Menominee vs Canadian Unemployment Among Women with Children Under 6 years
COMPARE
Menominee
Canadian
Unemployment Among Women with Children Under 6 years
Unemployment Among Women with Children Under 6 years Comparison
Menominee
Canadians
8.7%
UNEMPLOYMENT AMONG WOMEN WITH CHILDREN UNDER 6 YEARS
0.0/ 100
METRIC RATING
287th/ 347
METRIC RANK
7.8%
UNEMPLOYMENT AMONG WOMEN WITH CHILDREN UNDER 6 YEARS
20.6/ 100
METRIC RATING
207th/ 347
METRIC RANK
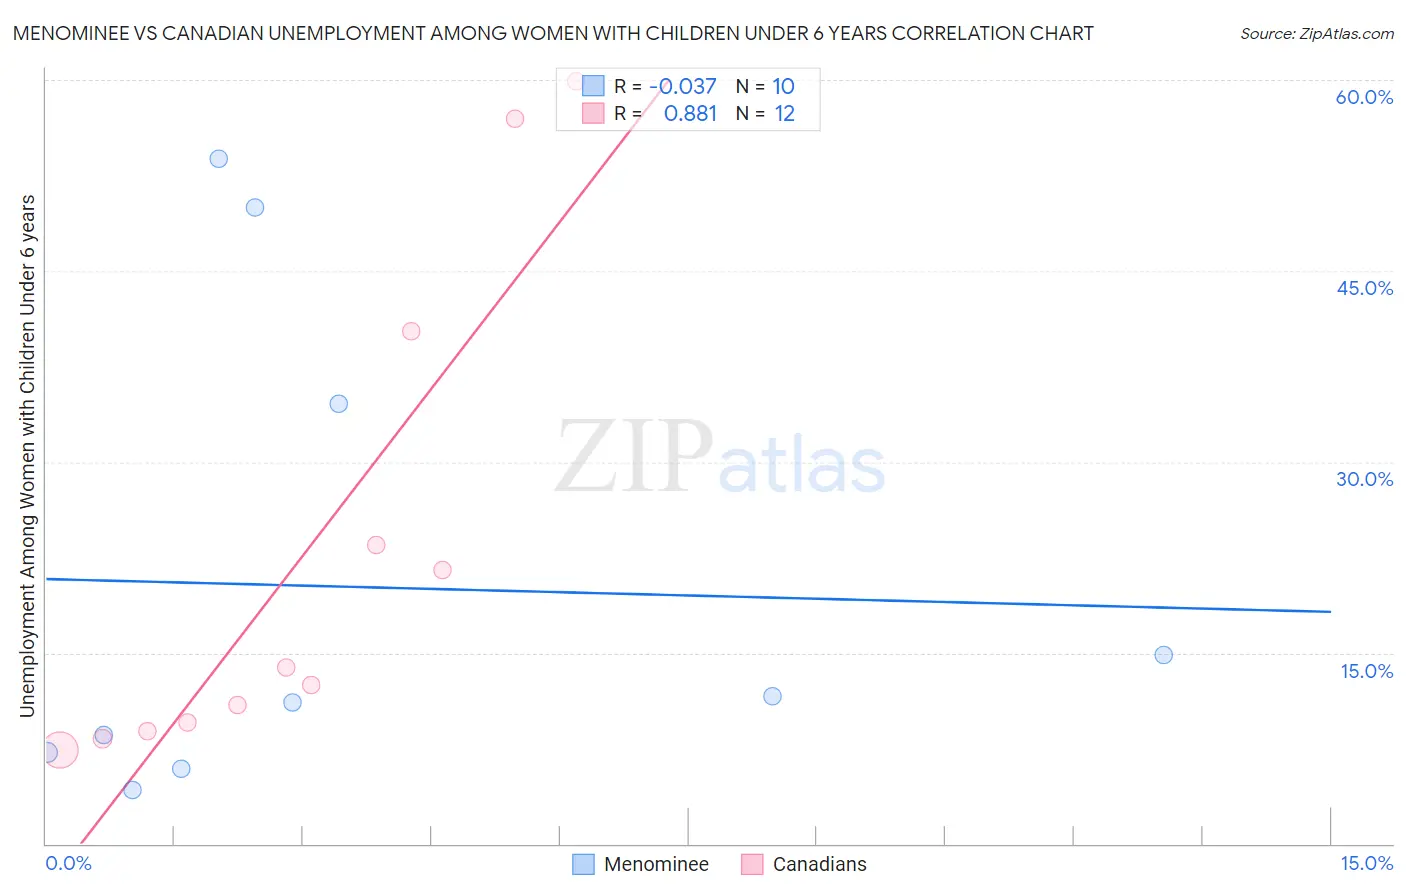
Menominee vs Canadian Unemployment Among Women with Children Under 6 years Correlation Chart
The statistical analysis conducted on geographies consisting of 41,178,371 people shows no correlation between the proportion of Menominee and unemployment rate among women with children under the age of 6 in the United States with a correlation coefficient (R) of -0.037 and weighted average of 8.7%. Similarly, the statistical analysis conducted on geographies consisting of 318,159,261 people shows a very strong positive correlation between the proportion of Canadians and unemployment rate among women with children under the age of 6 in the United States with a correlation coefficient (R) of 0.881 and weighted average of 7.8%, a difference of 11.5%.
Unemployment Among Women with Children Under 6 years Correlation Summary
| Measurement | Menominee | Canadian |
| Minimum | 4.2% | 7.4% |
| Maximum | 53.8% | 59.9% |
| Range | 49.6% | 52.5% |
| Mean | 20.2% | 22.8% |
| Median | 11.3% | 13.2% |
| Interquartile 25% (IQ1) | 7.2% | 9.2% |
| Interquartile 75% (IQ3) | 34.6% | 31.9% |
| Interquartile Range (IQR) | 27.4% | 22.7% |
| Standard Deviation (Sample) | 18.8% | 19.1% |
| Standard Deviation (Population) | 17.8% | 18.3% |
Similar Demographics by Unemployment Among Women with Children Under 6 years
Demographics Similar to Menominee by Unemployment Among Women with Children Under 6 years
In terms of unemployment among women with children under 6 years, the demographic groups most similar to Menominee are U.S. Virgin Islander (8.7%, a difference of 0.15%), Seminole (8.7%, a difference of 0.15%), Bahamian (8.7%, a difference of 0.20%), Iroquois (8.7%, a difference of 0.31%), and Blackfeet (8.7%, a difference of 0.35%).
| Demographics | Rating | Rank | Unemployment Among Women with Children Under 6 years |
| Immigrants | Belize | 0.0 /100 | #280 | Tragic 8.6% |
| Guatemalans | 0.0 /100 | #281 | Tragic 8.7% |
| Bermudans | 0.0 /100 | #282 | Tragic 8.7% |
| Spanish American Indians | 0.0 /100 | #283 | Tragic 8.7% |
| Blackfeet | 0.0 /100 | #284 | Tragic 8.7% |
| U.S. Virgin Islanders | 0.0 /100 | #285 | Tragic 8.7% |
| Seminole | 0.0 /100 | #286 | Tragic 8.7% |
| Menominee | 0.0 /100 | #287 | Tragic 8.7% |
| Bahamians | 0.0 /100 | #288 | Tragic 8.7% |
| Iroquois | 0.0 /100 | #289 | Tragic 8.7% |
| Vietnamese | 0.0 /100 | #290 | Tragic 8.8% |
| Jamaicans | 0.0 /100 | #291 | Tragic 8.8% |
| Cheyenne | 0.0 /100 | #292 | Tragic 8.8% |
| Immigrants | Bangladesh | 0.0 /100 | #293 | Tragic 8.8% |
| Immigrants | Nonimmigrants | 0.0 /100 | #294 | Tragic 8.8% |
Demographics Similar to Canadians by Unemployment Among Women with Children Under 6 years
In terms of unemployment among women with children under 6 years, the demographic groups most similar to Canadians are Hungarian (7.8%, a difference of 0.060%), Immigrants (7.8%, a difference of 0.070%), Lebanese (7.8%, a difference of 0.15%), Immigrants from Syria (7.8%, a difference of 0.18%), and Spaniard (7.8%, a difference of 0.26%).
| Demographics | Rating | Rank | Unemployment Among Women with Children Under 6 years |
| Guamanians/Chamorros | 25.5 /100 | #200 | Fair 7.8% |
| Basques | 24.7 /100 | #201 | Fair 7.8% |
| Sudanese | 23.5 /100 | #202 | Fair 7.8% |
| Spaniards | 23.3 /100 | #203 | Fair 7.8% |
| Lebanese | 22.2 /100 | #204 | Fair 7.8% |
| Immigrants | Immigrants | 21.4 /100 | #205 | Fair 7.8% |
| Hungarians | 21.2 /100 | #206 | Fair 7.8% |
| Canadians | 20.6 /100 | #207 | Fair 7.8% |
| Immigrants | Syria | 18.9 /100 | #208 | Poor 7.8% |
| Costa Ricans | 17.6 /100 | #209 | Poor 7.8% |
| Poles | 16.0 /100 | #210 | Poor 7.9% |
| Immigrants | Ecuador | 14.9 /100 | #211 | Poor 7.9% |
| Swiss | 12.3 /100 | #212 | Poor 7.9% |
| Scottish | 11.4 /100 | #213 | Poor 7.9% |
| Spanish | 11.3 /100 | #214 | Poor 7.9% |