Immigrants from the Azores vs Sioux Unemployment Among Women with Children Under 6 years
COMPARE
Immigrants from the Azores
Sioux
Unemployment Among Women with Children Under 6 years
Unemployment Among Women with Children Under 6 years Comparison
Immigrants from the Azores
Sioux
9.2%
UNEMPLOYMENT AMONG WOMEN WITH CHILDREN UNDER 6 YEARS
0.0/ 100
METRIC RATING
312th/ 347
METRIC RANK
11.5%
UNEMPLOYMENT AMONG WOMEN WITH CHILDREN UNDER 6 YEARS
0.0/ 100
METRIC RATING
332nd/ 347
METRIC RANK
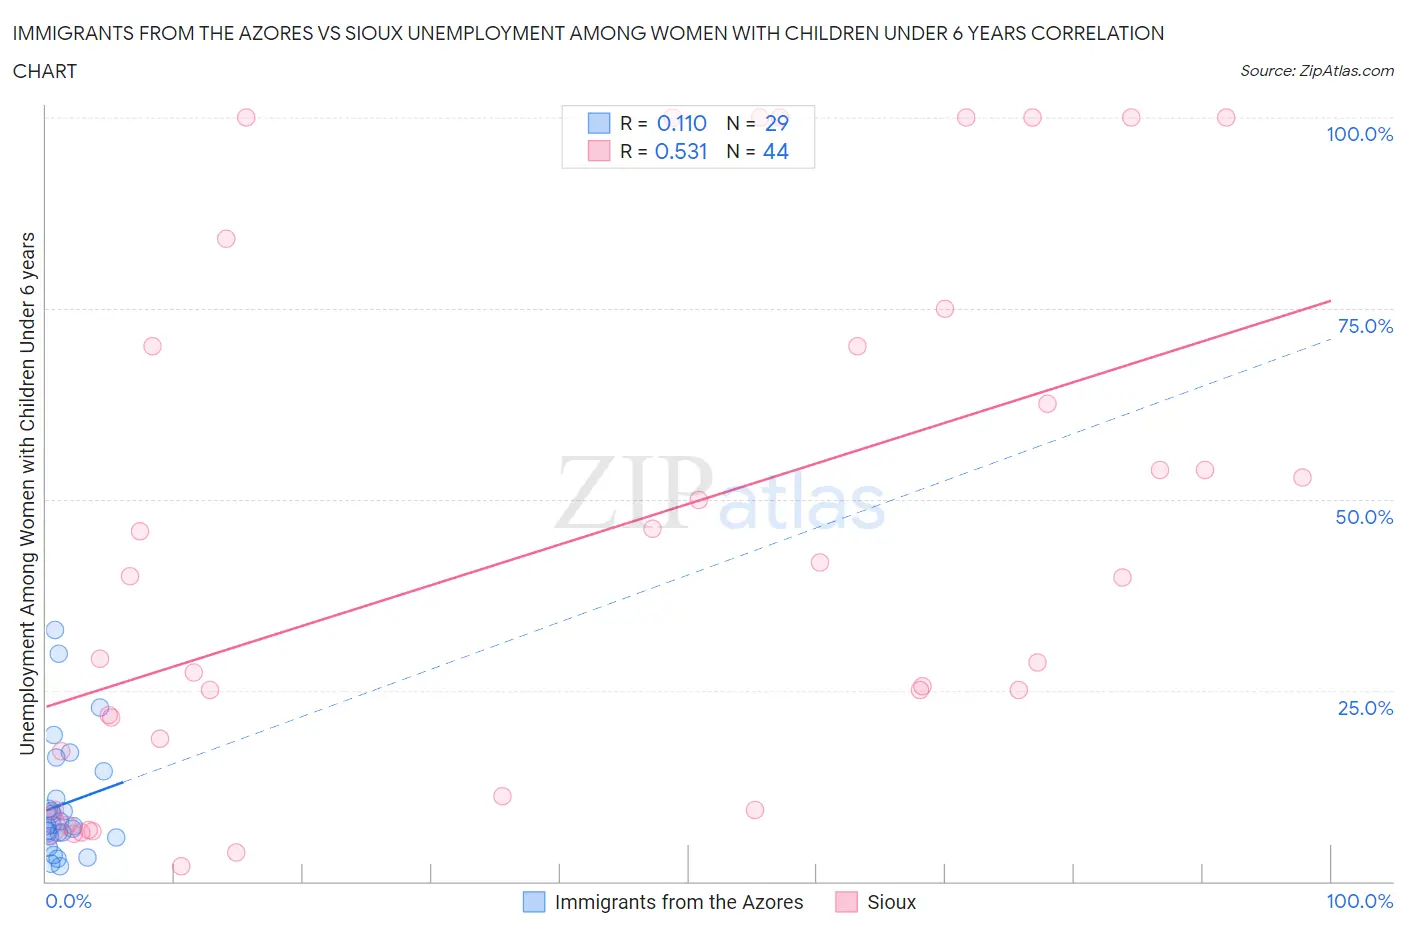
Immigrants from the Azores vs Sioux Unemployment Among Women with Children Under 6 years Correlation Chart
The statistical analysis conducted on geographies consisting of 40,648,611 people shows a poor positive correlation between the proportion of Immigrants from the Azores and unemployment rate among women with children under the age of 6 in the United States with a correlation coefficient (R) of 0.110 and weighted average of 9.2%. Similarly, the statistical analysis conducted on geographies consisting of 190,203,570 people shows a substantial positive correlation between the proportion of Sioux and unemployment rate among women with children under the age of 6 in the United States with a correlation coefficient (R) of 0.531 and weighted average of 11.5%, a difference of 24.4%.
Unemployment Among Women with Children Under 6 years Correlation Summary
| Measurement | Immigrants from the Azores | Sioux |
| Minimum | 2.0% | 2.0% |
| Maximum | 32.9% | 100.0% |
| Range | 30.9% | 98.0% |
| Mean | 10.1% | 43.8% |
| Median | 7.2% | 34.5% |
| Interquartile 25% (IQ1) | 5.8% | 14.1% |
| Interquartile 75% (IQ3) | 12.6% | 70.0% |
| Interquartile Range (IQR) | 6.8% | 55.9% |
| Standard Deviation (Sample) | 7.8% | 33.9% |
| Standard Deviation (Population) | 7.6% | 33.5% |
Demographics Similar to Immigrants from the Azores and Sioux by Unemployment Among Women with Children Under 6 years
In terms of unemployment among women with children under 6 years, the demographic groups most similar to Immigrants from the Azores are American (9.3%, a difference of 0.44%), Fijian (9.3%, a difference of 0.46%), Cherokee (9.3%, a difference of 1.2%), Houma (9.4%, a difference of 2.0%), and Dutch West Indian (9.5%, a difference of 2.8%). Similarly, the demographic groups most similar to Sioux are Colville (11.2%, a difference of 2.7%), Pennsylvania German (10.8%, a difference of 6.4%), Black/African American (10.3%, a difference of 11.5%), Tohono O'odham (10.2%, a difference of 12.4%), and Ottawa (9.9%, a difference of 16.1%).
| Demographics | Rating | Rank | Unemployment Among Women with Children Under 6 years |
| Immigrants | Azores | 0.0 /100 | #312 | Tragic 9.2% |
| Americans | 0.0 /100 | #313 | Tragic 9.3% |
| Fijians | 0.0 /100 | #314 | Tragic 9.3% |
| Cherokee | 0.0 /100 | #315 | Tragic 9.3% |
| Houma | 0.0 /100 | #316 | Tragic 9.4% |
| Dutch West Indians | 0.0 /100 | #317 | Tragic 9.5% |
| Osage | 0.0 /100 | #318 | Tragic 9.5% |
| Marshallese | 0.0 /100 | #319 | Tragic 9.6% |
| Potawatomi | 0.0 /100 | #320 | Tragic 9.6% |
| Central American Indians | 0.0 /100 | #321 | Tragic 9.6% |
| Alaska Natives | 0.0 /100 | #322 | Tragic 9.6% |
| Immigrants | Bahamas | 0.0 /100 | #323 | Tragic 9.6% |
| Paiute | 0.0 /100 | #324 | Tragic 9.7% |
| Choctaw | 0.0 /100 | #325 | Tragic 9.8% |
| Delaware | 0.0 /100 | #326 | Tragic 9.8% |
| Ottawa | 0.0 /100 | #327 | Tragic 9.9% |
| Tohono O'odham | 0.0 /100 | #328 | Tragic 10.2% |
| Blacks/African Americans | 0.0 /100 | #329 | Tragic 10.3% |
| Pennsylvania Germans | 0.0 /100 | #330 | Tragic 10.8% |
| Colville | 0.0 /100 | #331 | Tragic 11.2% |
| Sioux | 0.0 /100 | #332 | Tragic 11.5% |