Peruvian vs Belizean Unemployment Among Women with Children Ages 6 to 17 years
COMPARE
Peruvian
Belizean
Unemployment Among Women with Children Ages 6 to 17 years
Unemployment Among Women with Children Ages 6 to 17 years Comparison
Peruvians
Belizeans
9.2%
UNEMPLOYMENT AMONG WOMEN WITH CHILDREN AGES 6 TO 17 YEARS
9.0/ 100
METRIC RATING
212th/ 347
METRIC RANK
9.1%
UNEMPLOYMENT AMONG WOMEN WITH CHILDREN AGES 6 TO 17 YEARS
28.4/ 100
METRIC RATING
191st/ 347
METRIC RANK
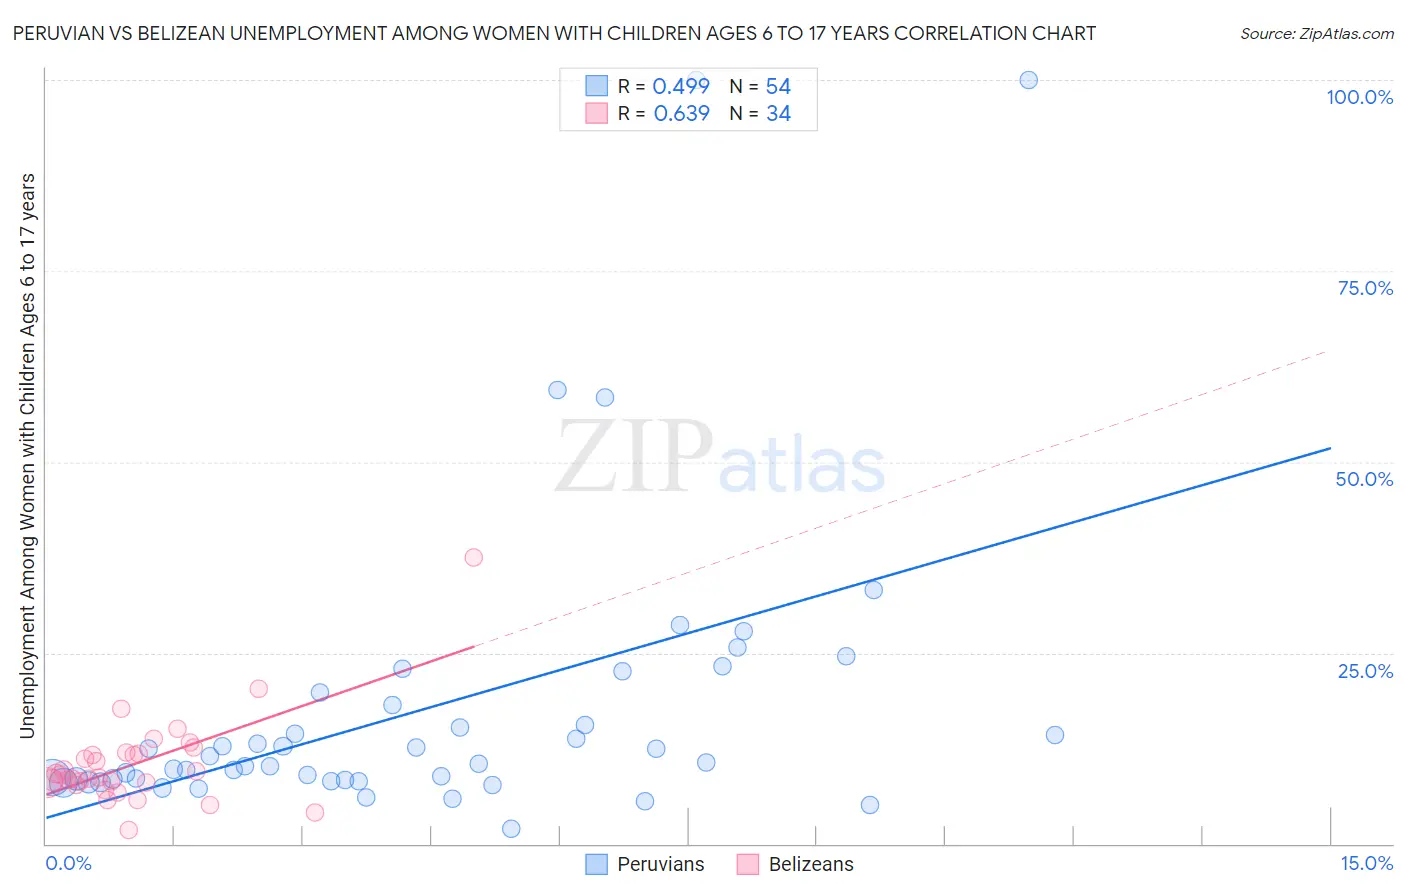
Peruvian vs Belizean Unemployment Among Women with Children Ages 6 to 17 years Correlation Chart
The statistical analysis conducted on geographies consisting of 270,138,716 people shows a moderate positive correlation between the proportion of Peruvians and unemployment rate among women with children between the ages 6 and 17 in the United States with a correlation coefficient (R) of 0.499 and weighted average of 9.2%. Similarly, the statistical analysis conducted on geographies consisting of 125,536,739 people shows a significant positive correlation between the proportion of Belizeans and unemployment rate among women with children between the ages 6 and 17 in the United States with a correlation coefficient (R) of 0.639 and weighted average of 9.1%, a difference of 1.5%.
Unemployment Among Women with Children Ages 6 to 17 years Correlation Summary
| Measurement | Peruvian | Belizean |
| Minimum | 1.9% | 1.8% |
| Maximum | 100.0% | 37.5% |
| Range | 98.1% | 35.7% |
| Mean | 17.6% | 10.4% |
| Median | 10.6% | 8.9% |
| Interquartile 25% (IQ1) | 8.3% | 8.0% |
| Interquartile 75% (IQ3) | 18.2% | 11.8% |
| Interquartile Range (IQR) | 9.9% | 3.8% |
| Standard Deviation (Sample) | 19.7% | 6.0% |
| Standard Deviation (Population) | 19.5% | 5.9% |
Similar Demographics by Unemployment Among Women with Children Ages 6 to 17 years
Demographics Similar to Peruvians by Unemployment Among Women with Children Ages 6 to 17 years
In terms of unemployment among women with children ages 6 to 17 years, the demographic groups most similar to Peruvians are Immigrants from Cuba (9.2%, a difference of 0.080%), Spaniard (9.2%, a difference of 0.11%), Finnish (9.2%, a difference of 0.13%), Iroquois (9.2%, a difference of 0.21%), and Immigrants from Peru (9.2%, a difference of 0.22%).
| Demographics | Rating | Rank | Unemployment Among Women with Children Ages 6 to 17 years |
| Immigrants | Western Europe | 14.1 /100 | #205 | Poor 9.1% |
| Immigrants | North America | 12.7 /100 | #206 | Poor 9.2% |
| Cubans | 10.9 /100 | #207 | Poor 9.2% |
| Immigrants | Peru | 10.8 /100 | #208 | Poor 9.2% |
| Salvadorans | 10.7 /100 | #209 | Poor 9.2% |
| Finns | 10.0 /100 | #210 | Tragic 9.2% |
| Immigrants | Cuba | 9.6 /100 | #211 | Tragic 9.2% |
| Peruvians | 9.0 /100 | #212 | Tragic 9.2% |
| Spaniards | 8.2 /100 | #213 | Tragic 9.2% |
| Iroquois | 7.5 /100 | #214 | Tragic 9.2% |
| Immigrants | Germany | 7.2 /100 | #215 | Tragic 9.2% |
| Immigrants | Uruguay | 7.2 /100 | #216 | Tragic 9.2% |
| Germans | 7.2 /100 | #217 | Tragic 9.2% |
| Syrians | 6.9 /100 | #218 | Tragic 9.2% |
| Immigrants | Scotland | 6.6 /100 | #219 | Tragic 9.2% |
Demographics Similar to Belizeans by Unemployment Among Women with Children Ages 6 to 17 years
In terms of unemployment among women with children ages 6 to 17 years, the demographic groups most similar to Belizeans are Slovene (9.1%, a difference of 0.0%), Immigrants (9.1%, a difference of 0.040%), Immigrants from Syria (9.1%, a difference of 0.070%), Guamanian/Chamorro (9.1%, a difference of 0.070%), and Comanche (9.0%, a difference of 0.080%).
| Demographics | Rating | Rank | Unemployment Among Women with Children Ages 6 to 17 years |
| Palestinians | 33.4 /100 | #184 | Fair 9.0% |
| Immigrants | Congo | 32.5 /100 | #185 | Fair 9.0% |
| Immigrants | Spain | 32.4 /100 | #186 | Fair 9.0% |
| Comanche | 30.0 /100 | #187 | Fair 9.0% |
| Immigrants | Syria | 29.7 /100 | #188 | Fair 9.1% |
| Immigrants | Immigrants | 29.2 /100 | #189 | Fair 9.1% |
| Slovenes | 28.5 /100 | #190 | Fair 9.1% |
| Belizeans | 28.4 /100 | #191 | Fair 9.1% |
| Guamanians/Chamorros | 27.2 /100 | #192 | Fair 9.1% |
| Immigrants | Turkey | 25.8 /100 | #193 | Fair 9.1% |
| Immigrants | Kazakhstan | 25.3 /100 | #194 | Fair 9.1% |
| Austrians | 25.0 /100 | #195 | Fair 9.1% |
| Brazilians | 24.4 /100 | #196 | Fair 9.1% |
| Immigrants | Panama | 24.3 /100 | #197 | Fair 9.1% |
| Guyanese | 21.8 /100 | #198 | Fair 9.1% |