Albanian vs Alaskan Athabascan Unemployment Among Women with Children Under 6 years
COMPARE
Albanian
Alaskan Athabascan
Unemployment Among Women with Children Under 6 years
Unemployment Among Women with Children Under 6 years Comparison
Albanians
Alaskan Athabascans
7.2%
UNEMPLOYMENT AMONG WOMEN WITH CHILDREN UNDER 6 YEARS
98.0/ 100
METRIC RATING
92nd/ 347
METRIC RANK
9.1%
UNEMPLOYMENT AMONG WOMEN WITH CHILDREN UNDER 6 YEARS
0.0/ 100
METRIC RATING
305th/ 347
METRIC RANK
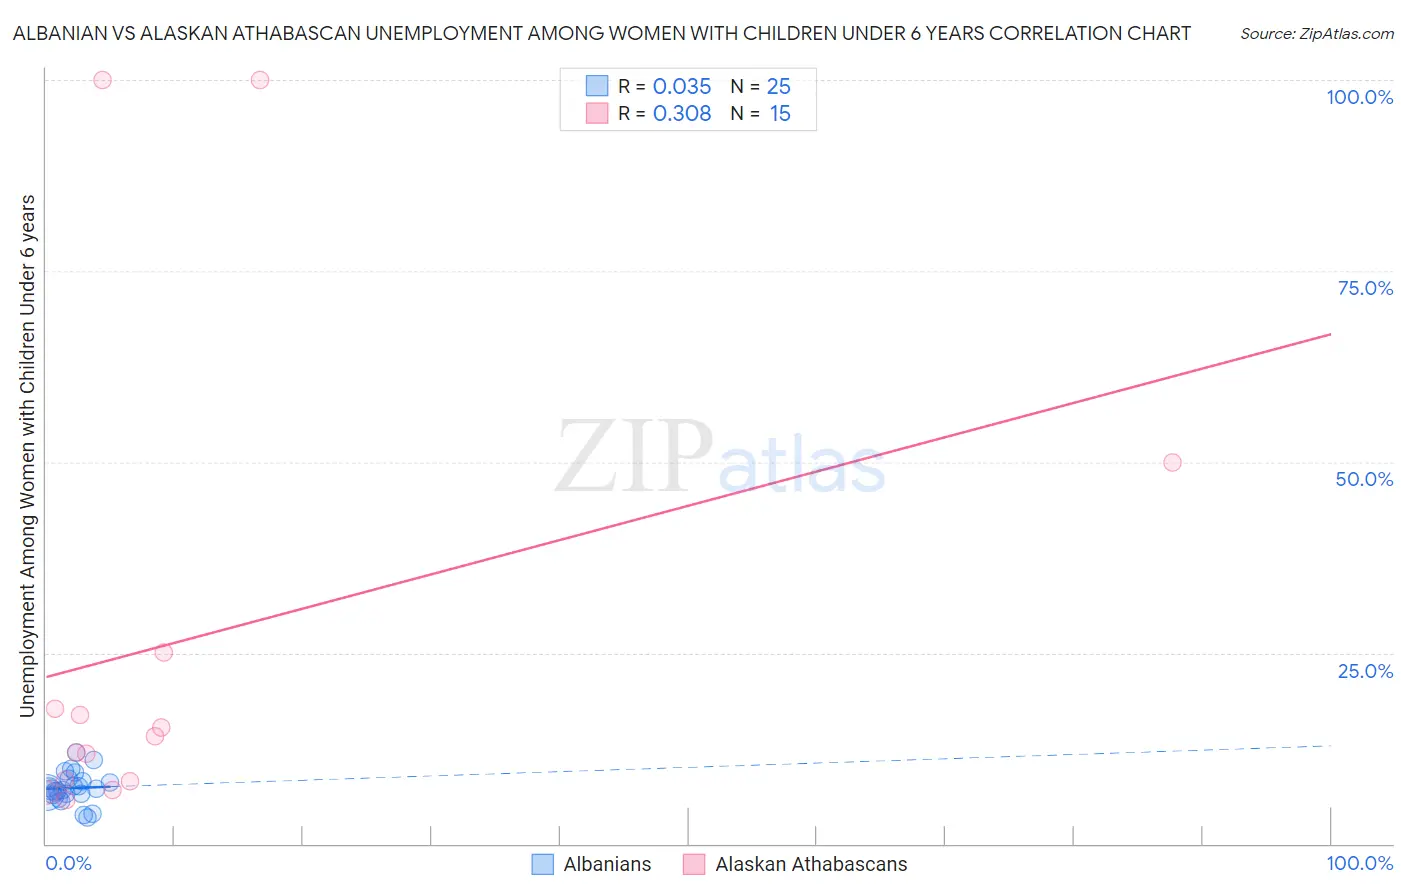
Albanian vs Alaskan Athabascan Unemployment Among Women with Children Under 6 years Correlation Chart
The statistical analysis conducted on geographies consisting of 159,066,011 people shows no correlation between the proportion of Albanians and unemployment rate among women with children under the age of 6 in the United States with a correlation coefficient (R) of 0.035 and weighted average of 7.2%. Similarly, the statistical analysis conducted on geographies consisting of 41,393,771 people shows a mild positive correlation between the proportion of Alaskan Athabascans and unemployment rate among women with children under the age of 6 in the United States with a correlation coefficient (R) of 0.308 and weighted average of 9.1%, a difference of 27.2%.
Unemployment Among Women with Children Under 6 years Correlation Summary
| Measurement | Albanian | Alaskan Athabascan |
| Minimum | 3.4% | 5.7% |
| Maximum | 12.0% | 100.0% |
| Range | 8.6% | 94.3% |
| Mean | 7.3% | 26.6% |
| Median | 7.0% | 14.1% |
| Interquartile 25% (IQ1) | 6.5% | 8.2% |
| Interquartile 75% (IQ3) | 8.4% | 25.0% |
| Interquartile Range (IQR) | 1.9% | 16.8% |
| Standard Deviation (Sample) | 2.0% | 31.7% |
| Standard Deviation (Population) | 2.0% | 30.7% |
Similar Demographics by Unemployment Among Women with Children Under 6 years
Demographics Similar to Albanians by Unemployment Among Women with Children Under 6 years
In terms of unemployment among women with children under 6 years, the demographic groups most similar to Albanians are Danish (7.1%, a difference of 0.14%), New Zealander (7.2%, a difference of 0.18%), Immigrants from Spain (7.1%, a difference of 0.20%), Immigrants from Denmark (7.1%, a difference of 0.25%), and Macedonian (7.2%, a difference of 0.25%).
| Demographics | Rating | Rank | Unemployment Among Women with Children Under 6 years |
| Immigrants | Romania | 98.7 /100 | #85 | Exceptional 7.1% |
| Immigrants | Zimbabwe | 98.6 /100 | #86 | Exceptional 7.1% |
| Alsatians | 98.4 /100 | #87 | Exceptional 7.1% |
| Immigrants | Hungary | 98.3 /100 | #88 | Exceptional 7.1% |
| Immigrants | Denmark | 98.3 /100 | #89 | Exceptional 7.1% |
| Immigrants | Spain | 98.2 /100 | #90 | Exceptional 7.1% |
| Danes | 98.2 /100 | #91 | Exceptional 7.1% |
| Albanians | 98.0 /100 | #92 | Exceptional 7.2% |
| New Zealanders | 97.8 /100 | #93 | Exceptional 7.2% |
| Macedonians | 97.7 /100 | #94 | Exceptional 7.2% |
| Romanians | 97.7 /100 | #95 | Exceptional 7.2% |
| Immigrants | Eastern Africa | 97.7 /100 | #96 | Exceptional 7.2% |
| Immigrants | South Eastern Asia | 97.6 /100 | #97 | Exceptional 7.2% |
| Russians | 97.5 /100 | #98 | Exceptional 7.2% |
| Immigrants | Europe | 97.5 /100 | #99 | Exceptional 7.2% |
Demographics Similar to Alaskan Athabascans by Unemployment Among Women with Children Under 6 years
In terms of unemployment among women with children under 6 years, the demographic groups most similar to Alaskan Athabascans are Pueblo (9.1%, a difference of 0.17%), Dominican (9.1%, a difference of 0.29%), Immigrants from Micronesia (9.1%, a difference of 0.36%), Immigrants from Mexico (9.1%, a difference of 0.41%), and Immigrants from West Indies (9.0%, a difference of 0.55%).
| Demographics | Rating | Rank | Unemployment Among Women with Children Under 6 years |
| Tlingit-Haida | 0.0 /100 | #298 | Tragic 8.9% |
| Immigrants | Jamaica | 0.0 /100 | #299 | Tragic 8.9% |
| Creek | 0.0 /100 | #300 | Tragic 8.9% |
| Chickasaw | 0.0 /100 | #301 | Tragic 9.0% |
| Hispanics or Latinos | 0.0 /100 | #302 | Tragic 9.0% |
| Immigrants | West Indies | 0.0 /100 | #303 | Tragic 9.0% |
| Immigrants | Mexico | 0.0 /100 | #304 | Tragic 9.1% |
| Alaskan Athabascans | 0.0 /100 | #305 | Tragic 9.1% |
| Pueblo | 0.0 /100 | #306 | Tragic 9.1% |
| Dominicans | 0.0 /100 | #307 | Tragic 9.1% |
| Immigrants | Micronesia | 0.0 /100 | #308 | Tragic 9.1% |
| Africans | 0.0 /100 | #309 | Tragic 9.2% |
| Cajuns | 0.0 /100 | #310 | Tragic 9.2% |
| French American Indians | 0.0 /100 | #311 | Tragic 9.2% |
| Immigrants | Azores | 0.0 /100 | #312 | Tragic 9.2% |