Immigrants from Thailand vs Alaskan Athabascan Unemployment Among Women with Children Under 6 years
COMPARE
Immigrants from Thailand
Alaskan Athabascan
Unemployment Among Women with Children Under 6 years
Unemployment Among Women with Children Under 6 years Comparison
Immigrants from Thailand
Alaskan Athabascans
7.7%
UNEMPLOYMENT AMONG WOMEN WITH CHILDREN UNDER 6 YEARS
38.5/ 100
METRIC RATING
187th/ 347
METRIC RANK
9.1%
UNEMPLOYMENT AMONG WOMEN WITH CHILDREN UNDER 6 YEARS
0.0/ 100
METRIC RATING
305th/ 347
METRIC RANK
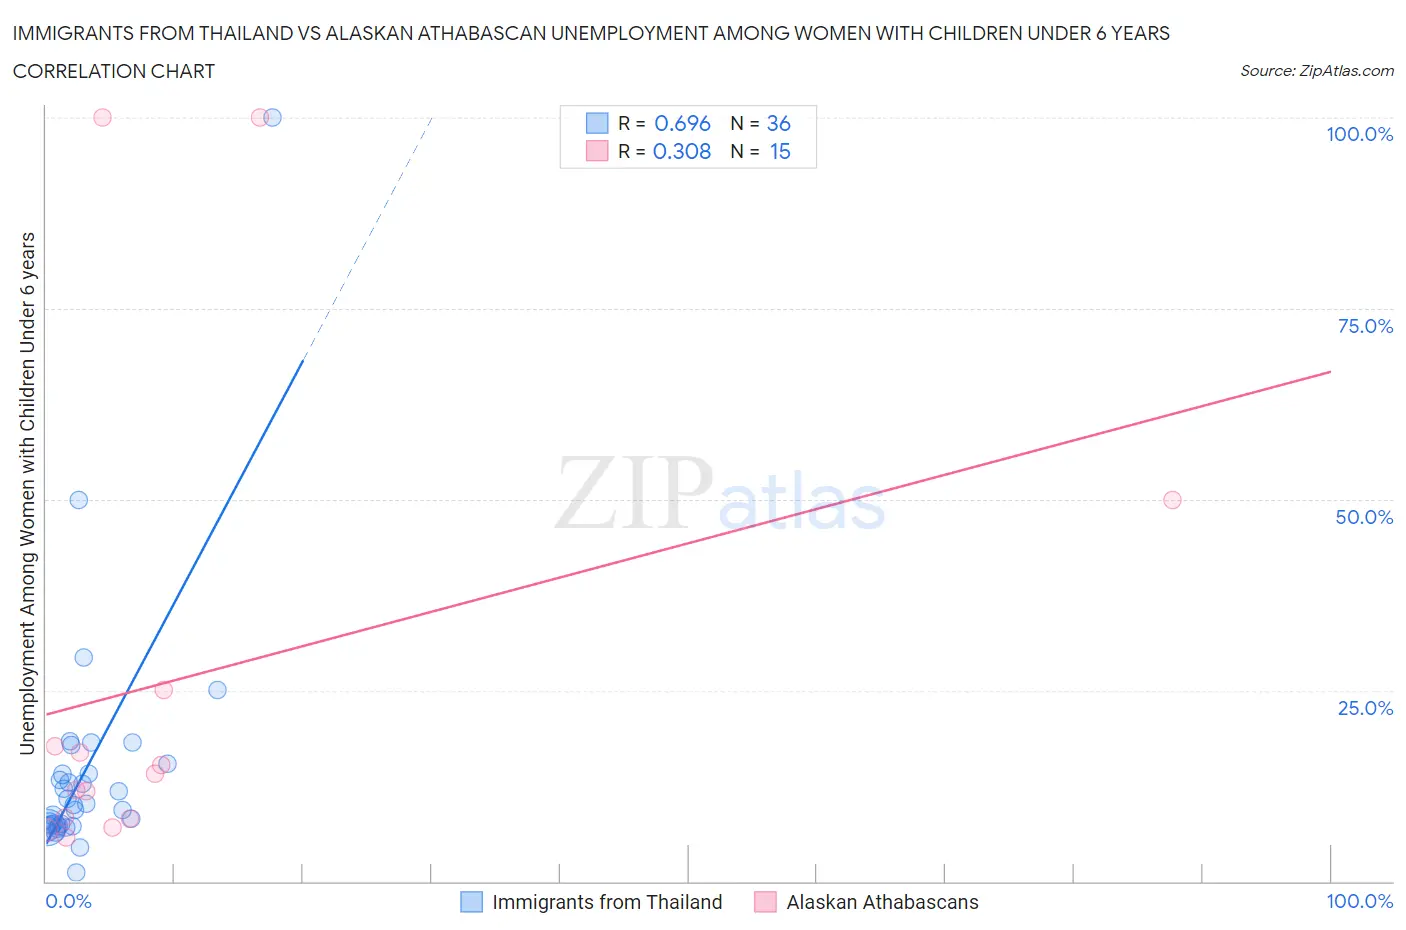
Immigrants from Thailand vs Alaskan Athabascan Unemployment Among Women with Children Under 6 years Correlation Chart
The statistical analysis conducted on geographies consisting of 254,495,229 people shows a significant positive correlation between the proportion of Immigrants from Thailand and unemployment rate among women with children under the age of 6 in the United States with a correlation coefficient (R) of 0.696 and weighted average of 7.7%. Similarly, the statistical analysis conducted on geographies consisting of 41,393,771 people shows a mild positive correlation between the proportion of Alaskan Athabascans and unemployment rate among women with children under the age of 6 in the United States with a correlation coefficient (R) of 0.308 and weighted average of 9.1%, a difference of 18.0%.
Unemployment Among Women with Children Under 6 years Correlation Summary
| Measurement | Immigrants from Thailand | Alaskan Athabascan |
| Minimum | 1.1% | 5.7% |
| Maximum | 100.0% | 100.0% |
| Range | 98.9% | 94.3% |
| Mean | 14.8% | 26.6% |
| Median | 10.0% | 14.1% |
| Interquartile 25% (IQ1) | 7.2% | 8.2% |
| Interquartile 75% (IQ3) | 14.7% | 25.0% |
| Interquartile Range (IQR) | 7.5% | 16.8% |
| Standard Deviation (Sample) | 16.9% | 31.7% |
| Standard Deviation (Population) | 16.7% | 30.7% |
Similar Demographics by Unemployment Among Women with Children Under 6 years
Demographics Similar to Immigrants from Thailand by Unemployment Among Women with Children Under 6 years
In terms of unemployment among women with children under 6 years, the demographic groups most similar to Immigrants from Thailand are Czechoslovakian (7.7%, a difference of 0.010%), Yugoslavian (7.7%, a difference of 0.060%), Spanish American (7.7%, a difference of 0.080%), Indonesian (7.7%, a difference of 0.14%), and Immigrants from Panama (7.7%, a difference of 0.20%).
| Demographics | Rating | Rank | Unemployment Among Women with Children Under 6 years |
| Immigrants | Uruguay | 44.5 /100 | #180 | Average 7.7% |
| Brazilians | 43.9 /100 | #181 | Average 7.7% |
| Nepalese | 43.5 /100 | #182 | Average 7.7% |
| Sierra Leoneans | 42.9 /100 | #183 | Average 7.7% |
| Indonesians | 40.5 /100 | #184 | Average 7.7% |
| Spanish Americans | 39.7 /100 | #185 | Fair 7.7% |
| Yugoslavians | 39.4 /100 | #186 | Fair 7.7% |
| Immigrants | Thailand | 38.5 /100 | #187 | Fair 7.7% |
| Czechoslovakians | 38.4 /100 | #188 | Fair 7.7% |
| Immigrants | Panama | 35.7 /100 | #189 | Fair 7.7% |
| Immigrants | North Macedonia | 34.4 /100 | #190 | Fair 7.7% |
| Immigrants | Austria | 32.4 /100 | #191 | Fair 7.7% |
| Immigrants | Africa | 32.4 /100 | #192 | Fair 7.7% |
| Slavs | 32.4 /100 | #193 | Fair 7.7% |
| Syrians | 31.9 /100 | #194 | Fair 7.7% |
Demographics Similar to Alaskan Athabascans by Unemployment Among Women with Children Under 6 years
In terms of unemployment among women with children under 6 years, the demographic groups most similar to Alaskan Athabascans are Pueblo (9.1%, a difference of 0.17%), Dominican (9.1%, a difference of 0.29%), Immigrants from Micronesia (9.1%, a difference of 0.36%), Immigrants from Mexico (9.1%, a difference of 0.41%), and Immigrants from West Indies (9.0%, a difference of 0.55%).
| Demographics | Rating | Rank | Unemployment Among Women with Children Under 6 years |
| Tlingit-Haida | 0.0 /100 | #298 | Tragic 8.9% |
| Immigrants | Jamaica | 0.0 /100 | #299 | Tragic 8.9% |
| Creek | 0.0 /100 | #300 | Tragic 8.9% |
| Chickasaw | 0.0 /100 | #301 | Tragic 9.0% |
| Hispanics or Latinos | 0.0 /100 | #302 | Tragic 9.0% |
| Immigrants | West Indies | 0.0 /100 | #303 | Tragic 9.0% |
| Immigrants | Mexico | 0.0 /100 | #304 | Tragic 9.1% |
| Alaskan Athabascans | 0.0 /100 | #305 | Tragic 9.1% |
| Pueblo | 0.0 /100 | #306 | Tragic 9.1% |
| Dominicans | 0.0 /100 | #307 | Tragic 9.1% |
| Immigrants | Micronesia | 0.0 /100 | #308 | Tragic 9.1% |
| Africans | 0.0 /100 | #309 | Tragic 9.2% |
| Cajuns | 0.0 /100 | #310 | Tragic 9.2% |
| French American Indians | 0.0 /100 | #311 | Tragic 9.2% |
| Immigrants | Azores | 0.0 /100 | #312 | Tragic 9.2% |