Immigrants from Western Africa vs Navajo Unemployment
COMPARE
Immigrants from Western Africa
Navajo
Unemployment
Unemployment Comparison
Immigrants from Western Africa
Navajo
6.0%
UNEMPLOYMENT
0.0/ 100
METRIC RATING
280th/ 347
METRIC RANK
8.4%
UNEMPLOYMENT
0.0/ 100
METRIC RATING
339th/ 347
METRIC RANK
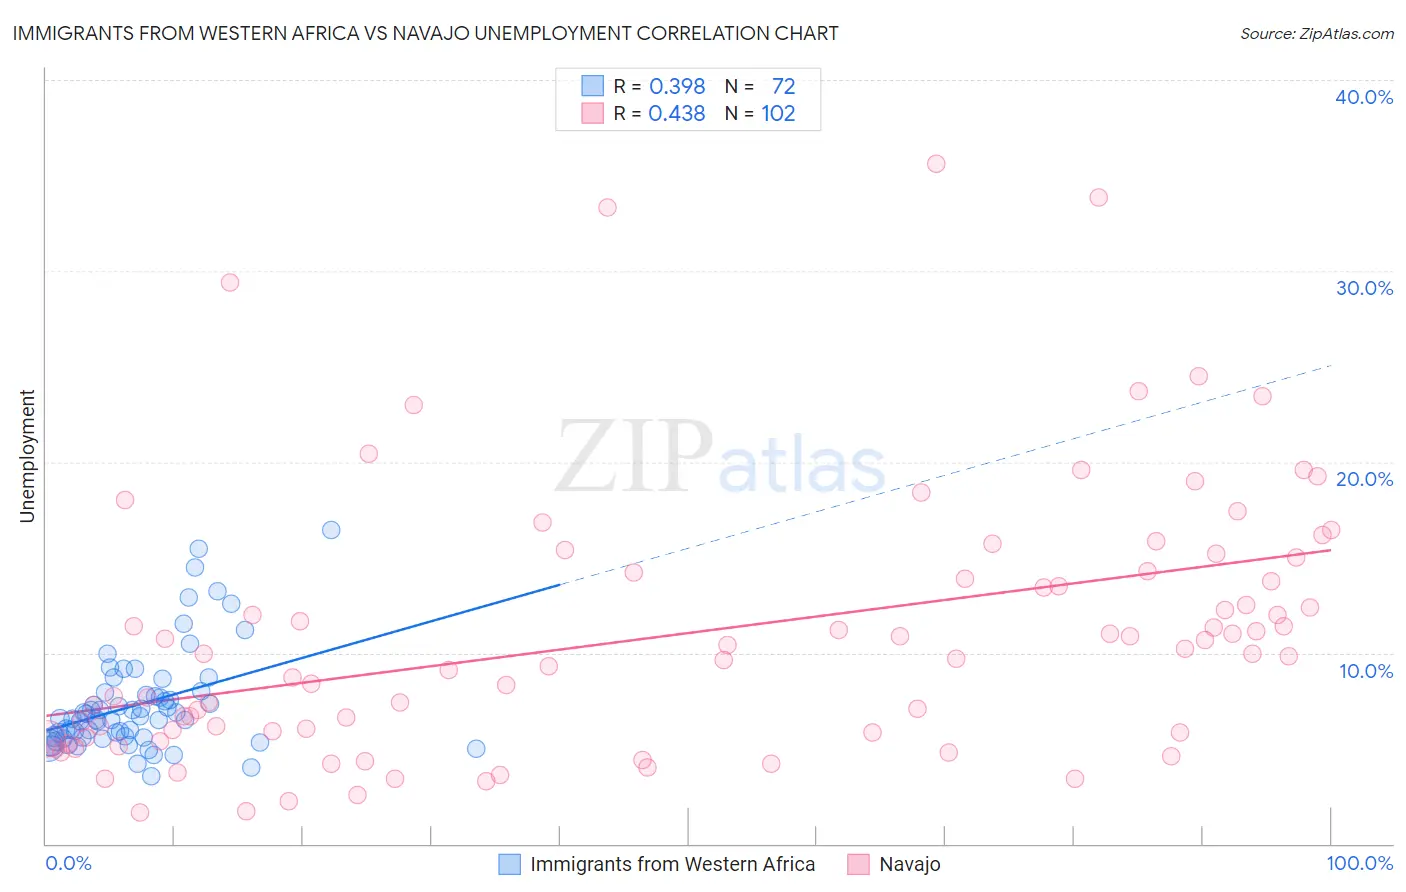
Immigrants from Western Africa vs Navajo Unemployment Correlation Chart
The statistical analysis conducted on geographies consisting of 357,683,143 people shows a mild positive correlation between the proportion of Immigrants from Western Africa and unemployment in the United States with a correlation coefficient (R) of 0.398 and weighted average of 6.0%. Similarly, the statistical analysis conducted on geographies consisting of 224,594,128 people shows a moderate positive correlation between the proportion of Navajo and unemployment in the United States with a correlation coefficient (R) of 0.438 and weighted average of 8.4%, a difference of 38.8%.
Unemployment Correlation Summary
| Measurement | Immigrants from Western Africa | Navajo |
| Minimum | 3.5% | 1.6% |
| Maximum | 16.4% | 35.6% |
| Range | 12.9% | 34.0% |
| Mean | 7.3% | 10.9% |
| Median | 6.5% | 9.9% |
| Interquartile 25% (IQ1) | 5.6% | 5.8% |
| Interquartile 75% (IQ3) | 7.9% | 14.2% |
| Interquartile Range (IQR) | 2.3% | 8.4% |
| Standard Deviation (Sample) | 2.7% | 7.0% |
| Standard Deviation (Population) | 2.6% | 7.0% |
Similar Demographics by Unemployment
Demographics Similar to Immigrants from Western Africa by Unemployment
In terms of unemployment, the demographic groups most similar to Immigrants from Western Africa are Immigrants from Mexico (6.0%, a difference of 0.0%), Ghanaian (6.0%, a difference of 0.43%), African (6.1%, a difference of 0.58%), Immigrants from the Azores (6.1%, a difference of 0.64%), and Armenian (6.0%, a difference of 0.73%).
| Demographics | Rating | Rank | Unemployment |
| Immigrants | Fiji | 0.0 /100 | #273 | Tragic 5.9% |
| Bahamians | 0.0 /100 | #274 | Tragic 5.9% |
| Immigrants | Latin America | 0.0 /100 | #275 | Tragic 5.9% |
| Immigrants | Central America | 0.0 /100 | #276 | Tragic 6.0% |
| Armenians | 0.0 /100 | #277 | Tragic 6.0% |
| Ghanaians | 0.0 /100 | #278 | Tragic 6.0% |
| Immigrants | Mexico | 0.0 /100 | #279 | Tragic 6.0% |
| Immigrants | Western Africa | 0.0 /100 | #280 | Tragic 6.0% |
| Africans | 0.0 /100 | #281 | Tragic 6.1% |
| Immigrants | Azores | 0.0 /100 | #282 | Tragic 6.1% |
| Immigrants | Ghana | 0.0 /100 | #283 | Tragic 6.1% |
| Aleuts | 0.0 /100 | #284 | Tragic 6.1% |
| Immigrants | Senegal | 0.0 /100 | #285 | Tragic 6.1% |
| Immigrants | Caribbean | 0.0 /100 | #286 | Tragic 6.2% |
| Nepalese | 0.0 /100 | #287 | Tragic 6.2% |
Demographics Similar to Navajo by Unemployment
In terms of unemployment, the demographic groups most similar to Navajo are Puerto Rican (8.4%, a difference of 0.79%), Pima (8.2%, a difference of 1.6%), Cheyenne (8.0%, a difference of 4.4%), Tohono O'odham (8.9%, a difference of 6.3%), and Hopi (8.9%, a difference of 6.7%).
| Demographics | Rating | Rank | Unemployment |
| Sioux | 0.0 /100 | #332 | Tragic 7.4% |
| Immigrants | Dominican Republic | 0.0 /100 | #333 | Tragic 7.4% |
| Apache | 0.0 /100 | #334 | Tragic 7.4% |
| Alaskan Athabascans | 0.0 /100 | #335 | Tragic 7.7% |
| Immigrants | Yemen | 0.0 /100 | #336 | Tragic 7.7% |
| Cheyenne | 0.0 /100 | #337 | Tragic 8.0% |
| Pima | 0.0 /100 | #338 | Tragic 8.2% |
| Navajo | 0.0 /100 | #339 | Tragic 8.4% |
| Puerto Ricans | 0.0 /100 | #340 | Tragic 8.4% |
| Tohono O'odham | 0.0 /100 | #341 | Tragic 8.9% |
| Hopi | 0.0 /100 | #342 | Tragic 8.9% |
| Yuman | 0.0 /100 | #343 | Tragic 9.1% |
| Arapaho | 0.0 /100 | #344 | Tragic 9.8% |
| Inupiat | 0.0 /100 | #345 | Tragic 10.1% |
| Crow | 0.0 /100 | #346 | Tragic 11.1% |