Marshallese vs Immigrants from Kazakhstan Master's Degree
COMPARE
Marshallese
Immigrants from Kazakhstan
Master's Degree
Master's Degree Comparison
Marshallese
Immigrants from Kazakhstan
11.6%
MASTER'S DEGREE
0.1/ 100
METRIC RATING
295th/ 347
METRIC RANK
18.0%
MASTER'S DEGREE
99.8/ 100
METRIC RATING
65th/ 347
METRIC RANK
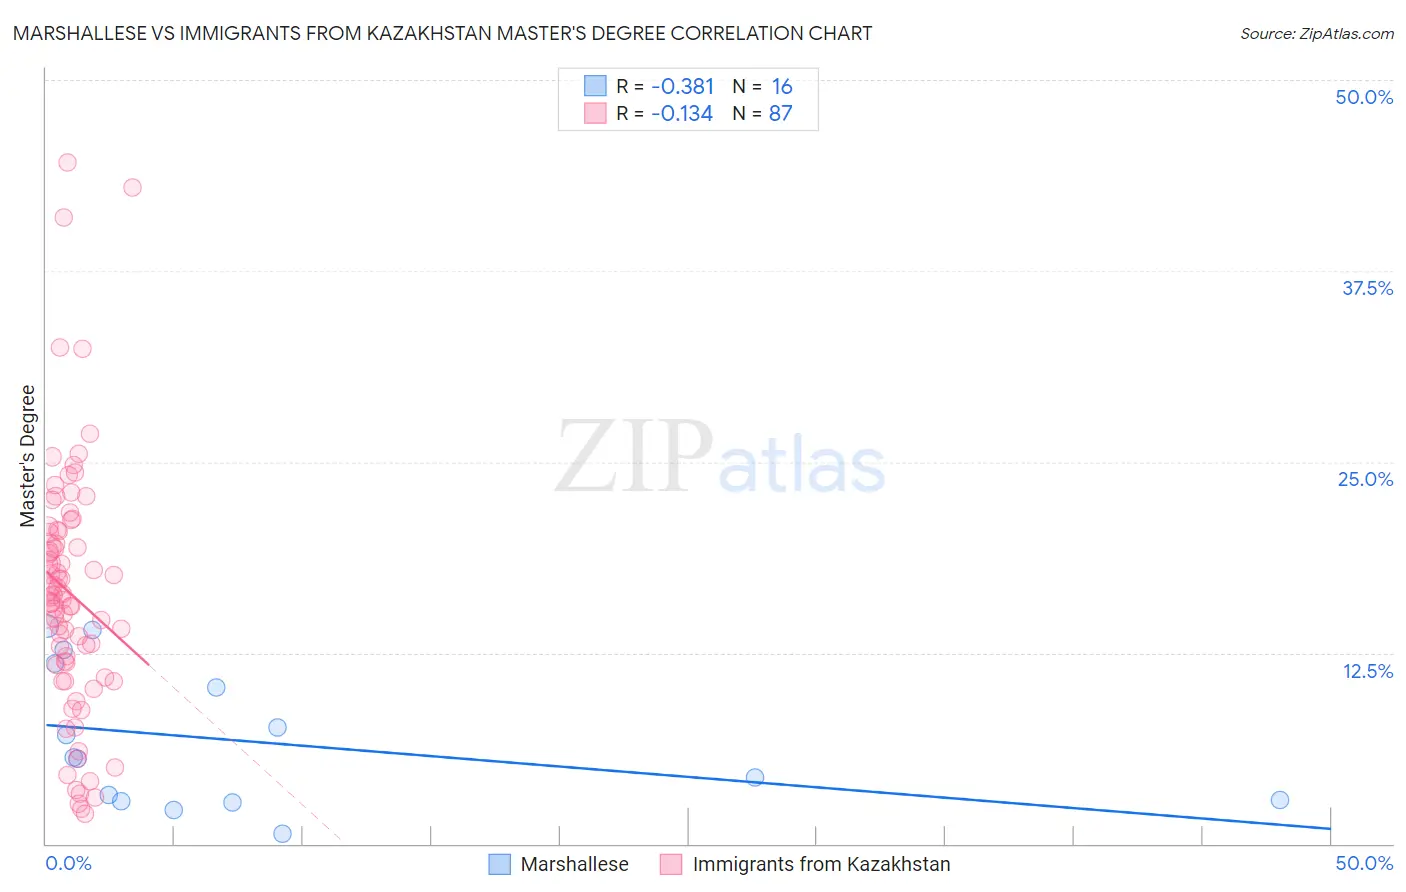
Marshallese vs Immigrants from Kazakhstan Master's Degree Correlation Chart
The statistical analysis conducted on geographies consisting of 14,761,315 people shows a mild negative correlation between the proportion of Marshallese and percentage of population with at least master's degree education in the United States with a correlation coefficient (R) of -0.381 and weighted average of 11.6%. Similarly, the statistical analysis conducted on geographies consisting of 124,419,458 people shows a poor negative correlation between the proportion of Immigrants from Kazakhstan and percentage of population with at least master's degree education in the United States with a correlation coefficient (R) of -0.134 and weighted average of 18.0%, a difference of 55.3%.
Master's Degree Correlation Summary
| Measurement | Marshallese | Immigrants from Kazakhstan |
| Minimum | 0.68% | 1.9% |
| Maximum | 14.2% | 44.6% |
| Range | 13.6% | 42.7% |
| Mean | 6.7% | 16.4% |
| Median | 5.6% | 16.2% |
| Interquartile 25% (IQ1) | 2.8% | 11.7% |
| Interquartile 75% (IQ3) | 11.0% | 20.5% |
| Interquartile Range (IQR) | 8.2% | 8.7% |
| Standard Deviation (Sample) | 4.5% | 8.3% |
| Standard Deviation (Population) | 4.4% | 8.2% |
Similar Demographics by Master's Degree
Demographics Similar to Marshallese by Master's Degree
In terms of master's degree, the demographic groups most similar to Marshallese are Alaskan Athabascan (11.6%, a difference of 0.010%), Immigrants from Yemen (11.6%, a difference of 0.13%), Hawaiian (11.6%, a difference of 0.15%), Alaska Native (11.6%, a difference of 0.25%), and Immigrants from Guatemala (11.6%, a difference of 0.48%).
| Demographics | Rating | Rank | Master's Degree |
| Immigrants | Honduras | 0.1 /100 | #288 | Tragic 11.8% |
| Guatemalans | 0.1 /100 | #289 | Tragic 11.7% |
| Ute | 0.1 /100 | #290 | Tragic 11.7% |
| Colville | 0.1 /100 | #291 | Tragic 11.6% |
| Immigrants | Guatemala | 0.1 /100 | #292 | Tragic 11.6% |
| Alaska Natives | 0.1 /100 | #293 | Tragic 11.6% |
| Hawaiians | 0.1 /100 | #294 | Tragic 11.6% |
| Marshallese | 0.1 /100 | #295 | Tragic 11.6% |
| Alaskan Athabascans | 0.1 /100 | #296 | Tragic 11.6% |
| Immigrants | Yemen | 0.1 /100 | #297 | Tragic 11.6% |
| Samoans | 0.1 /100 | #298 | Tragic 11.5% |
| Chickasaw | 0.1 /100 | #299 | Tragic 11.4% |
| Chippewa | 0.1 /100 | #300 | Tragic 11.4% |
| Tsimshian | 0.1 /100 | #301 | Tragic 11.4% |
| Cherokee | 0.1 /100 | #302 | Tragic 11.4% |
Demographics Similar to Immigrants from Kazakhstan by Master's Degree
In terms of master's degree, the demographic groups most similar to Immigrants from Kazakhstan are Ethiopian (18.0%, a difference of 0.020%), Immigrants from Argentina (18.0%, a difference of 0.070%), Immigrants from Ethiopia (17.9%, a difference of 0.30%), Immigrants from Uzbekistan (17.9%, a difference of 0.62%), and South African (18.1%, a difference of 0.70%).
| Demographics | Rating | Rank | Master's Degree |
| Australians | 99.9 /100 | #58 | Exceptional 18.4% |
| Immigrants | Bulgaria | 99.9 /100 | #59 | Exceptional 18.3% |
| New Zealanders | 99.9 /100 | #60 | Exceptional 18.3% |
| Immigrants | Europe | 99.9 /100 | #61 | Exceptional 18.2% |
| Argentineans | 99.9 /100 | #62 | Exceptional 18.2% |
| Immigrants | Netherlands | 99.9 /100 | #63 | Exceptional 18.1% |
| South Africans | 99.9 /100 | #64 | Exceptional 18.1% |
| Immigrants | Kazakhstan | 99.8 /100 | #65 | Exceptional 18.0% |
| Ethiopians | 99.8 /100 | #66 | Exceptional 18.0% |
| Immigrants | Argentina | 99.8 /100 | #67 | Exceptional 18.0% |
| Immigrants | Ethiopia | 99.8 /100 | #68 | Exceptional 17.9% |
| Immigrants | Uzbekistan | 99.8 /100 | #69 | Exceptional 17.9% |
| Immigrants | Western Europe | 99.8 /100 | #70 | Exceptional 17.8% |
| Immigrants | Pakistan | 99.7 /100 | #71 | Exceptional 17.8% |
| Lithuanians | 99.7 /100 | #72 | Exceptional 17.7% |