Marshallese vs Immigrants from Kazakhstan Child Poverty Among Boys Under 16
COMPARE
Marshallese
Immigrants from Kazakhstan
Child Poverty Among Boys Under 16
Child Poverty Among Boys Under 16 Comparison
Marshallese
Immigrants from Kazakhstan
18.4%
CHILD POVERTY AMONG BOYS UNDER 16
1.3/ 100
METRIC RATING
232nd/ 347
METRIC RANK
15.5%
CHILD POVERTY AMONG BOYS UNDER 16
88.7/ 100
METRIC RATING
132nd/ 347
METRIC RANK
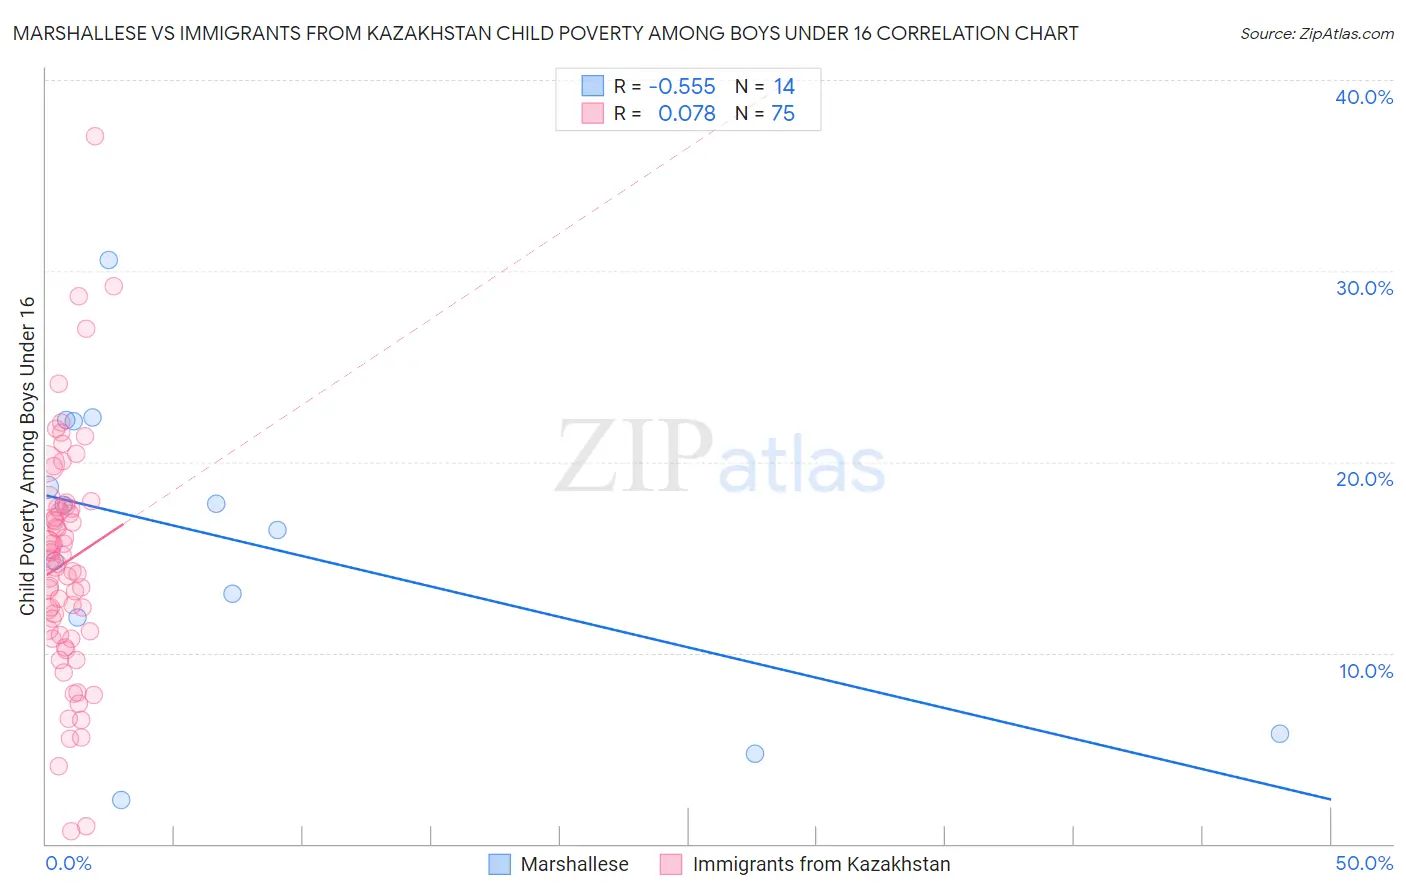
Marshallese vs Immigrants from Kazakhstan Child Poverty Among Boys Under 16 Correlation Chart
The statistical analysis conducted on geographies consisting of 14,730,412 people shows a substantial negative correlation between the proportion of Marshallese and poverty level among boys under the age of 16 in the United States with a correlation coefficient (R) of -0.555 and weighted average of 18.4%. Similarly, the statistical analysis conducted on geographies consisting of 123,737,741 people shows a slight positive correlation between the proportion of Immigrants from Kazakhstan and poverty level among boys under the age of 16 in the United States with a correlation coefficient (R) of 0.078 and weighted average of 15.5%, a difference of 18.9%.
Child Poverty Among Boys Under 16 Correlation Summary
| Measurement | Marshallese | Immigrants from Kazakhstan |
| Minimum | 2.3% | 0.67% |
| Maximum | 30.6% | 37.0% |
| Range | 28.3% | 36.4% |
| Mean | 15.7% | 14.7% |
| Median | 17.1% | 14.7% |
| Interquartile 25% (IQ1) | 11.8% | 11.0% |
| Interquartile 75% (IQ3) | 22.2% | 17.6% |
| Interquartile Range (IQR) | 10.3% | 6.7% |
| Standard Deviation (Sample) | 7.8% | 6.2% |
| Standard Deviation (Population) | 7.5% | 6.1% |
Similar Demographics by Child Poverty Among Boys Under 16
Demographics Similar to Marshallese by Child Poverty Among Boys Under 16
In terms of child poverty among boys under 16, the demographic groups most similar to Marshallese are Immigrants from Nigeria (18.4%, a difference of 0.19%), Nicaraguan (18.4%, a difference of 0.20%), Nigerian (18.5%, a difference of 0.44%), Immigrants from Micronesia (18.3%, a difference of 0.73%), and Fijian (18.3%, a difference of 0.73%).
| Demographics | Rating | Rank | Child Poverty Among Boys Under 16 |
| Inupiat | 2.7 /100 | #225 | Tragic 18.1% |
| Immigrants | Africa | 2.6 /100 | #226 | Tragic 18.1% |
| Bermudans | 2.5 /100 | #227 | Tragic 18.1% |
| Immigrants | Nonimmigrants | 2.2 /100 | #228 | Tragic 18.2% |
| Immigrants | Micronesia | 1.8 /100 | #229 | Tragic 18.3% |
| Fijians | 1.8 /100 | #230 | Tragic 18.3% |
| Nicaraguans | 1.4 /100 | #231 | Tragic 18.4% |
| Marshallese | 1.3 /100 | #232 | Tragic 18.4% |
| Immigrants | Nigeria | 1.2 /100 | #233 | Tragic 18.4% |
| Nigerians | 1.1 /100 | #234 | Tragic 18.5% |
| Americans | 0.9 /100 | #235 | Tragic 18.6% |
| Sudanese | 0.9 /100 | #236 | Tragic 18.6% |
| Immigrants | Eritrea | 0.8 /100 | #237 | Tragic 18.6% |
| Immigrants | Laos | 0.8 /100 | #238 | Tragic 18.7% |
| Cape Verdeans | 0.7 /100 | #239 | Tragic 18.7% |
Demographics Similar to Immigrants from Kazakhstan by Child Poverty Among Boys Under 16
In terms of child poverty among boys under 16, the demographic groups most similar to Immigrants from Kazakhstan are Welsh (15.5%, a difference of 0.11%), Peruvian (15.5%, a difference of 0.15%), Portuguese (15.5%, a difference of 0.33%), Icelander (15.5%, a difference of 0.34%), and Immigrants from Western Europe (15.4%, a difference of 0.43%).
| Demographics | Rating | Rank | Child Poverty Among Boys Under 16 |
| Czechoslovakians | 92.1 /100 | #125 | Exceptional 15.3% |
| Palestinians | 91.3 /100 | #126 | Exceptional 15.4% |
| Carpatho Rusyns | 91.1 /100 | #127 | Exceptional 15.4% |
| Canadians | 90.6 /100 | #128 | Exceptional 15.4% |
| Immigrants | Brazil | 90.3 /100 | #129 | Exceptional 15.4% |
| Mongolians | 90.2 /100 | #130 | Exceptional 15.4% |
| Immigrants | Western Europe | 90.0 /100 | #131 | Exceptional 15.4% |
| Immigrants | Kazakhstan | 88.7 /100 | #132 | Excellent 15.5% |
| Welsh | 88.3 /100 | #133 | Excellent 15.5% |
| Peruvians | 88.1 /100 | #134 | Excellent 15.5% |
| Portuguese | 87.5 /100 | #135 | Excellent 15.5% |
| Icelanders | 87.5 /100 | #136 | Excellent 15.5% |
| Immigrants | Spain | 87.1 /100 | #137 | Excellent 15.6% |
| Immigrants | Southern Europe | 86.5 /100 | #138 | Excellent 15.6% |
| Albanians | 86.5 /100 | #139 | Excellent 15.6% |