Maltese vs Tlingit-Haida Female Unemployment

COMPARE

Maltese
Race
Ancestry
AfghanAfricanAlaska NativeAlaskan AthabascanAlbanianAleutAlsatianAmericanApacheArabArapahoArgentineanArmenianAssyrian/Chaldean/SyriacAustralianAustrianBahamianBangladeshiBarbadianBasqueBelgianBelizeanBermudanBhutaneseBlackfeetBolivianBrazilianBritishBritish West IndianBulgarianBurmeseCajunCambodianCanadianCape VerdeanCarpatho RusynCelticCentral AmericanCentral American IndianCherokeeCheyenneChickasawChileanChineseChippewaChoctawColombianColvilleComancheCosta RicanCreeCreekCroatianCrowCubanCypriotCzechCzechoslovakianDanishDelawareDominicanDutchDutch West IndianEastern EuropeanEcuadorianEgyptianEnglishEstonianEthiopianEuropeanFijianFilipinoFinnishFrenchFrench American IndianFrench CanadianGermanGerman RussianGhanaianGreekGuamanian/ChamorroGuatemalanGuyaneseHaitianHmongHonduranHopiHoumaHungarianIcelanderIndian (Asian)IndonesianInupiatIranianIraqiIrishIroquoisIsraeliItalianJamaicanJapaneseJordanianKenyanKiowaKoreanLaotianLatvianLebaneseLiberianLithuanianLumbeeLuxembourgerMacedonianMalaysianMalteseMarshalleseMenomineeMexicanMexican American IndianMongolianMoroccanNative HawaiianNavajoNepaleseNew ZealanderNicaraguanNigerianNorthern EuropeanNorwegianOkinawanOsageOttawaPaiutePakistaniPalestinianPanamanianParaguayanPennsylvania GermanPeruvianPimaPolishPortuguesePotawatomiPuebloPuerto RicanPuget Sound SalishRomanianRussianSalvadoranSamoanScandinavianScotch-IrishScottishSeminoleSenegaleseSerbianShoshoneSierra LeoneanSiouxSlavicSlovakSloveneSomaliSouth AfricanSouth AmericanSouth American IndianSoviet UnionSpaniardSpanishSpanish AmericanSpanish American IndianSri LankanSubsaharan AfricanSudaneseSwedishSwissSyrianTaiwaneseThaiTohono O'OdhamTonganTrinidadian and TobagonianTsimshianTurkishU.S. Virgin IslanderUgandanUkrainianUruguayanUteVenezuelanVietnameseWelshWest IndianYakamaYaquiYugoslavianYumanYup'ikZimbabwean
Immigration
NonimmigrantsImmigrantsAfghanistanAfricaAlbaniaArgentinaArmeniaAsiaAustraliaAustriaBahamasBangladeshBarbadosBelarusBelgiumBelizeBoliviaBosnia and HerzegovinaBrazilBulgariaBurma/MyanmarCabo VerdeCambodiaCameroonCanadaCaribbeanCentral AmericaChileChinaColombiaCongoCosta RicaCroatiaCubaCzechoslovakiaDenmarkDominicaDominican RepublicEastern AfricaEastern AsiaEastern EuropeEcuadorEgyptEl SalvadorEnglandEritreaEthiopiaEuropeFijiFranceGermanyGhanaGreeceGrenadaGuatemalaGuyanaHaitiHondurasHong KongHungaryIndiaIndonesiaIranIraqIrelandIsraelItalyJamaicaJapanJordanKazakhstanKenyaKoreaKuwaitLaosLatin AmericaLatviaLebanonLiberiaLithuaniaMalaysiaMexicoMicronesiaMiddle AfricaMoldovaMoroccoNepalNetherlandsNicaraguaNigeriaNorth AmericaNorth MacedoniaNorthern AfricaNorthern EuropeNorwayOceaniaPakistanPanamaPeruPhilippinesPolandPortugalRomaniaRussiaSaudi ArabiaScotlandSenegalSerbiaSierra LeoneSingaporeSomaliaSouth AfricaSouth AmericaSouth Central AsiaSouth Eastern AsiaSouthern EuropeSpainSri LankaSt. Vincent and the GrenadinesSudanSwedenSwitzerlandSyriaTaiwanThailandTrinidad and TobagoTurkeyUgandaUkraineUruguayUzbekistanVenezuelaVietnamWest IndiesWestern AfricaWestern AsiaWestern EuropeYemenZaireZimbabweAzores
Tlingit-Haida
Race
Ancestry
AfghanAfricanAlaska NativeAlaskan AthabascanAlbanianAleutAlsatianAmericanApacheArabArapahoArgentineanArmenianAssyrian/Chaldean/SyriacAustralianAustrianBahamianBangladeshiBarbadianBasqueBelgianBelizeanBermudanBhutaneseBlackfeetBolivianBrazilianBritishBritish West IndianBulgarianBurmeseCajunCambodianCanadianCape VerdeanCarpatho RusynCelticCentral AmericanCentral American IndianCherokeeCheyenneChickasawChileanChineseChippewaChoctawColombianColvilleComancheCosta RicanCreeCreekCroatianCrowCubanCypriotCzechCzechoslovakianDanishDelawareDominicanDutchDutch West IndianEastern EuropeanEcuadorianEgyptianEnglishEstonianEthiopianEuropeanFijianFilipinoFinnishFrenchFrench American IndianFrench CanadianGermanGerman RussianGhanaianGreekGuamanian/ChamorroGuatemalanGuyaneseHaitianHmongHonduranHopiHoumaHungarianIcelanderIndian (Asian)IndonesianInupiatIranianIraqiIrishIroquoisIsraeliItalianJamaicanJapaneseJordanianKenyanKiowaKoreanLaotianLatvianLebaneseLiberianLithuanianLumbeeLuxembourgerMacedonianMalaysianMarshalleseMenomineeMexicanMexican American IndianMongolianMoroccanNative HawaiianNavajoNepaleseNew ZealanderNicaraguanNigerianNorthern EuropeanNorwegianOkinawanOsageOttawaPaiutePakistaniPalestinianPanamanianParaguayanPennsylvania GermanPeruvianPimaPolishPortuguesePotawatomiPuebloPuerto RicanPuget Sound SalishRomanianRussianSalvadoranSamoanScandinavianScotch-IrishScottishSeminoleSenegaleseSerbianShoshoneSierra LeoneanSiouxSlavicSlovakSloveneSomaliSouth AfricanSouth AmericanSouth American IndianSoviet UnionSpaniardSpanishSpanish AmericanSpanish American IndianSri LankanSubsaharan AfricanSudaneseSwedishSwissSyrianTaiwaneseThaiTlingit-HaidaTohono O'OdhamTonganTrinidadian and TobagonianTsimshianTurkishU.S. Virgin IslanderUgandanUkrainianUruguayanUteVenezuelanVietnameseWelshWest IndianYakamaYaquiYugoslavianYumanYup'ikZimbabwean
Immigration
NonimmigrantsImmigrantsAfghanistanAfricaAlbaniaArgentinaArmeniaAsiaAustraliaAustriaBahamasBangladeshBarbadosBelarusBelgiumBelizeBoliviaBosnia and HerzegovinaBrazilBulgariaBurma/MyanmarCabo VerdeCambodiaCameroonCanadaCaribbeanCentral AmericaChileChinaColombiaCongoCosta RicaCroatiaCubaCzechoslovakiaDenmarkDominicaDominican RepublicEastern AfricaEastern AsiaEastern EuropeEcuadorEgyptEl SalvadorEnglandEritreaEthiopiaEuropeFijiFranceGermanyGhanaGreeceGrenadaGuatemalaGuyanaHaitiHondurasHong KongHungaryIndiaIndonesiaIranIraqIrelandIsraelItalyJamaicaJapanJordanKazakhstanKenyaKoreaKuwaitLaosLatin AmericaLatviaLebanonLiberiaLithuaniaMalaysiaMexicoMicronesiaMiddle AfricaMoldovaMoroccoNepalNetherlandsNicaraguaNigeriaNorth AmericaNorth MacedoniaNorthern AfricaNorthern EuropeNorwayOceaniaPakistanPanamaPeruPhilippinesPolandPortugalRomaniaRussiaSaudi ArabiaScotlandSenegalSerbiaSierra LeoneSingaporeSomaliaSouth AfricaSouth AmericaSouth Central AsiaSouth Eastern AsiaSouthern EuropeSpainSri LankaSt. Vincent and the GrenadinesSudanSwedenSwitzerlandSyriaTaiwanThailandTrinidad and TobagoTurkeyUgandaUkraineUruguayUzbekistanVenezuelaVietnamWest IndiesWestern AfricaWestern AsiaWestern EuropeYemenZaireZimbabweAzores
Female Unemployment
Income
Poverty
Unemployment
Labor Participation
Family Structure
Vehicle Availability
Education Level
Disability

Female Unemployment Comparison

Maltese

Tlingit-Haida

Excellent
Exceptional
5.1%
FEMALE UNEMPLOYMENT
85.5/ 100
METRIC RATING
130th/ 347
METRIC RANK
4.9%
FEMALE UNEMPLOYMENT
98.3/ 100
METRIC RATING
68th/ 347
METRIC RANK

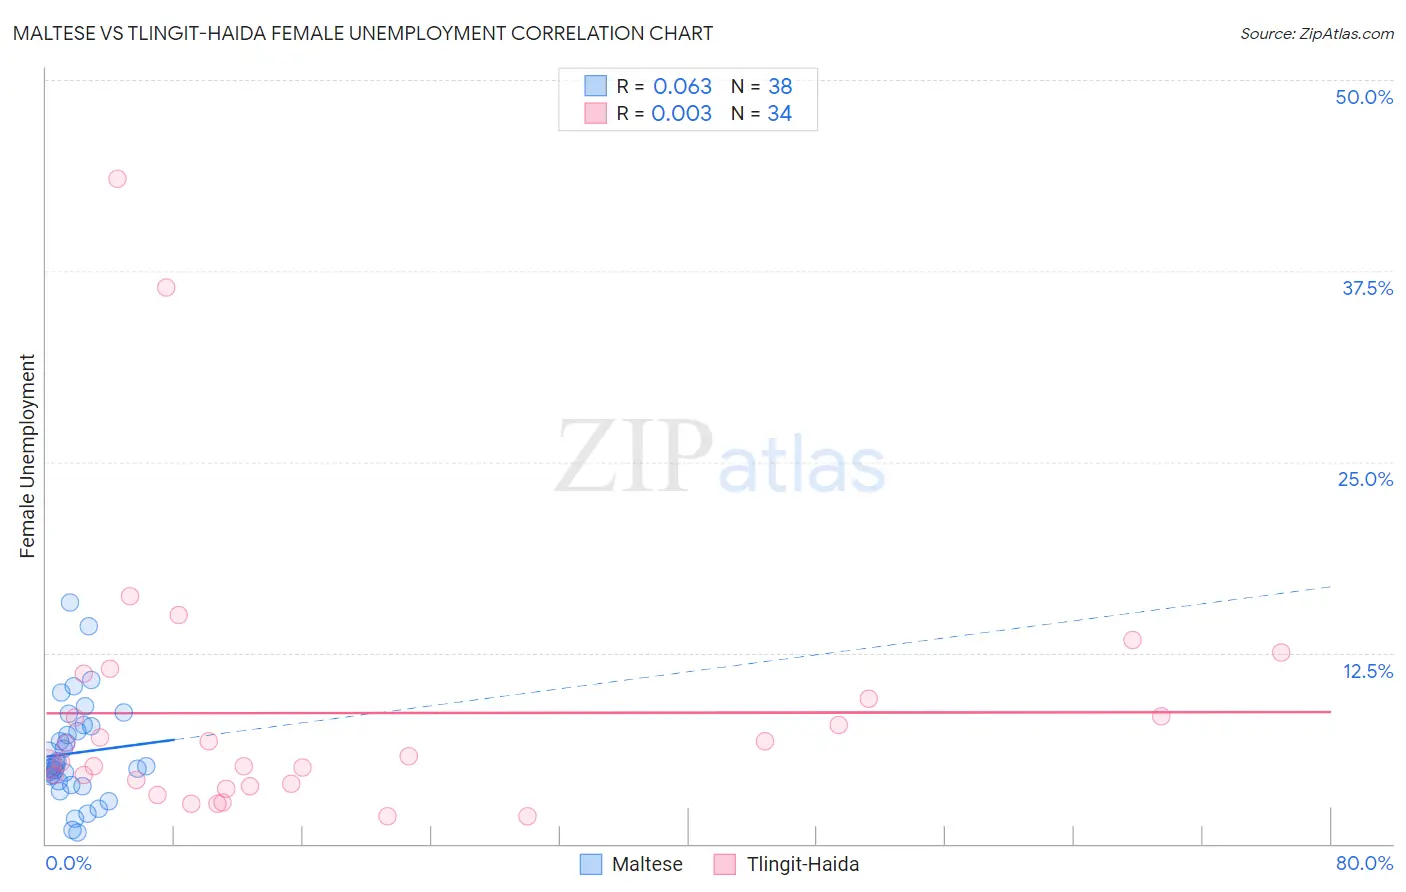
Maltese vs Tlingit-Haida Female Unemployment Correlation Chart

The statistical analysis conducted on geographies consisting of 126,272,771 people shows a slight positive correlation between the proportion of Maltese and unemploymnet rate among females in the United States with a correlation coefficient (R) of 0.063 and weighted average of 5.1%. Similarly, the statistical analysis conducted on geographies consisting of 60,741,997 people shows no correlation between the proportion of Tlingit-Haida and unemploymnet rate among females in the United States with a correlation coefficient (R) of 0.003 and weighted average of 4.9%, a difference of 3.6%.
Maltese vs Tlingit-Haida Female Unemployment

Female Unemployment Correlation Summary

MeasurementMalteseTlingit-Haida
Minimum0.70%1.8%
Maximum15.8%43.5%
Range15.1%41.7%
Mean5.9%8.6%
Median5.0%5.5%
Interquartile 25% (IQ1)4.1%3.9%
Interquartile 75% (IQ3)7.7%9.5%
Interquartile Range (IQR)3.6%5.6%
Standard Deviation (Sample)3.3%8.8%
Standard Deviation (Population)3.2%8.7%

Similar Demographics by Female Unemployment

Demographics Similar to Maltese by Female Unemployment

In terms of female unemployment, the demographic groups most similar to Maltese are Immigrants from Ethiopia (5.1%, a difference of 0.020%), Ethiopian (5.1%, a difference of 0.030%), Chilean (5.1%, a difference of 0.040%), Immigrants from Hungary (5.1%, a difference of 0.070%), and Immigrants from Sri Lanka (5.1%, a difference of 0.070%).
DemographicsRating | RankFemale Unemployment
Immigrants | South Africa
87.6
/100
|
#123
Excellent
5.1%
Immigrants | Europe
87.2
/100
|
#124
Excellent
5.1%
Basques
86.5
/100
|
#125
Excellent
5.1%
Immigrants | Korea
86.3
/100
|
#126
Excellent
5.1%
Immigrants | Hungary
86.0
/100
|
#127
Excellent
5.1%
Chileans
85.8
/100
|
#128
Excellent
5.1%
Ethiopians
85.7
/100
|
#129
Excellent
5.1%
Maltese
85.5
/100
|
#130
Excellent
5.1%
Immigrants | Ethiopia
85.4
/100
|
#131
Excellent
5.1%
Immigrants | Sri Lanka
85.0
/100
|
#132
Excellent
5.1%
Immigrants | Hong Kong
84.8
/100
|
#133
Excellent
5.1%
Immigrants | Eritrea
84.6
/100
|
#134
Excellent
5.1%
Immigrants | Latvia
84.6
/100
|
#135
Excellent
5.1%
Indians (Asian)
84.2
/100
|
#136
Excellent
5.1%
Pakistanis
83.8
/100
|
#137
Excellent
5.1%

Demographics Similar to Tlingit-Haida by Female Unemployment

In terms of female unemployment, the demographic groups most similar to Tlingit-Haida are Hungarian (4.9%, a difference of 0.010%), Cuban (4.9%, a difference of 0.010%), Immigrants from Ireland (4.9%, a difference of 0.010%), Immigrants from North America (4.9%, a difference of 0.040%), and Osage (4.9%, a difference of 0.050%).
DemographicsRating | RankFemale Unemployment
Immigrants | Canada
98.6
/100
|
#61
Exceptional
4.9%
Immigrants | Nepal
98.6
/100
|
#62
Exceptional
4.9%
Immigrants | Belgium
98.5
/100
|
#63
Exceptional
4.9%
Celtics
98.5
/100
|
#64
Exceptional
4.9%
Immigrants | North America
98.3
/100
|
#65
Exceptional
4.9%
Hungarians
98.3
/100
|
#66
Exceptional
4.9%
Cubans
98.3
/100
|
#67
Exceptional
4.9%
Tlingit-Haida
98.3
/100
|
#68
Exceptional
4.9%
Immigrants | Ireland
98.2
/100
|
#69
Exceptional
4.9%
Osage
98.2
/100
|
#70
Exceptional
4.9%
German Russians
98.1
/100
|
#71
Exceptional
4.9%
Immigrants | Northern Europe
98.0
/100
|
#72
Exceptional
4.9%
Russians
98.0
/100
|
#73
Exceptional
5.0%
Immigrants | Bolivia
98.0
/100
|
#74
Exceptional
5.0%
Immigrants | Singapore
98.0
/100
|
#75
Exceptional
5.0%