Maltese vs Bermudan Unemployment Among Women with Children Under 6 years
COMPARE
Maltese
Bermudan
Unemployment Among Women with Children Under 6 years
Unemployment Among Women with Children Under 6 years Comparison
Maltese
Bermudans
6.9%
UNEMPLOYMENT AMONG WOMEN WITH CHILDREN UNDER 6 YEARS
99.7/ 100
METRIC RATING
63rd/ 347
METRIC RANK
8.7%
UNEMPLOYMENT AMONG WOMEN WITH CHILDREN UNDER 6 YEARS
0.0/ 100
METRIC RATING
282nd/ 347
METRIC RANK
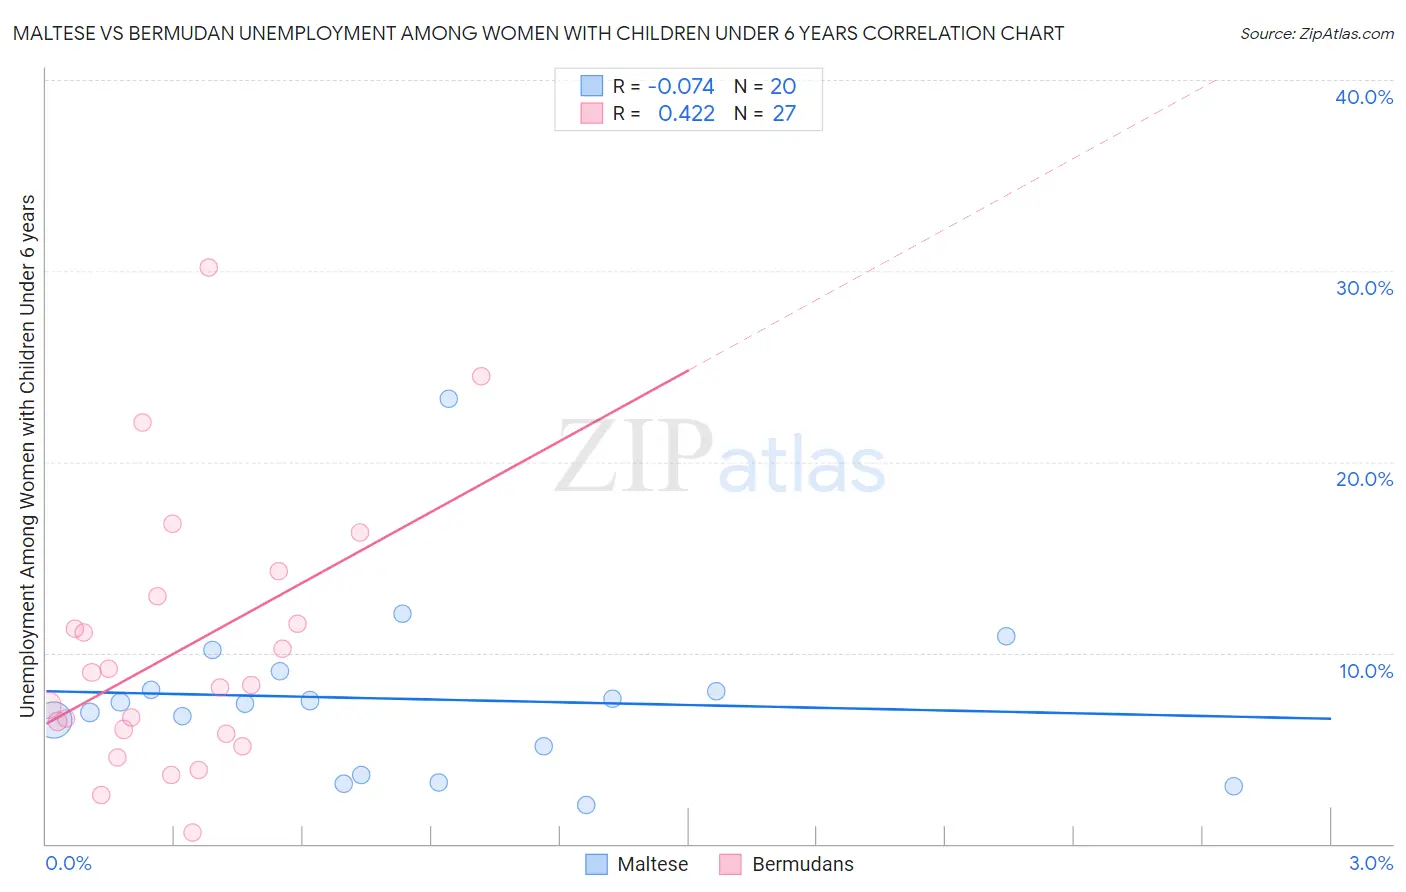
Maltese vs Bermudan Unemployment Among Women with Children Under 6 years Correlation Chart
The statistical analysis conducted on geographies consisting of 109,228,269 people shows a slight negative correlation between the proportion of Maltese and unemployment rate among women with children under the age of 6 in the United States with a correlation coefficient (R) of -0.074 and weighted average of 6.9%. Similarly, the statistical analysis conducted on geographies consisting of 52,533,202 people shows a moderate positive correlation between the proportion of Bermudans and unemployment rate among women with children under the age of 6 in the United States with a correlation coefficient (R) of 0.422 and weighted average of 8.7%, a difference of 25.5%.
Unemployment Among Women with Children Under 6 years Correlation Summary
| Measurement | Maltese | Bermudan |
| Minimum | 2.0% | 0.60% |
| Maximum | 23.3% | 30.2% |
| Range | 21.3% | 29.6% |
| Mean | 7.6% | 10.2% |
| Median | 7.4% | 8.3% |
| Interquartile 25% (IQ1) | 4.3% | 5.8% |
| Interquartile 75% (IQ3) | 8.5% | 13.0% |
| Interquartile Range (IQR) | 4.2% | 7.2% |
| Standard Deviation (Sample) | 4.6% | 6.9% |
| Standard Deviation (Population) | 4.5% | 6.8% |
Similar Demographics by Unemployment Among Women with Children Under 6 years
Demographics Similar to Maltese by Unemployment Among Women with Children Under 6 years
In terms of unemployment among women with children under 6 years, the demographic groups most similar to Maltese are Somali (6.9%, a difference of 0.050%), Immigrants from France (6.9%, a difference of 0.090%), Tongan (6.9%, a difference of 0.10%), Immigrants from Kuwait (6.9%, a difference of 0.25%), and Immigrants from Sri Lanka (6.9%, a difference of 0.46%).
| Demographics | Rating | Rank | Unemployment Among Women with Children Under 6 years |
| Immigrants | Ethiopia | 99.8 /100 | #56 | Exceptional 6.9% |
| Icelanders | 99.8 /100 | #57 | Exceptional 6.9% |
| Immigrants | Turkey | 99.8 /100 | #58 | Exceptional 6.9% |
| Immigrants | Serbia | 99.8 /100 | #59 | Exceptional 6.9% |
| Immigrants | Sri Lanka | 99.8 /100 | #60 | Exceptional 6.9% |
| Immigrants | France | 99.7 /100 | #61 | Exceptional 6.9% |
| Somalis | 99.7 /100 | #62 | Exceptional 6.9% |
| Maltese | 99.7 /100 | #63 | Exceptional 6.9% |
| Tongans | 99.7 /100 | #64 | Exceptional 6.9% |
| Immigrants | Kuwait | 99.7 /100 | #65 | Exceptional 6.9% |
| Immigrants | Belgium | 99.6 /100 | #66 | Exceptional 6.9% |
| Immigrants | Netherlands | 99.5 /100 | #67 | Exceptional 7.0% |
| Paraguayans | 99.4 /100 | #68 | Exceptional 7.0% |
| Immigrants | Eritrea | 99.4 /100 | #69 | Exceptional 7.0% |
| Immigrants | Iraq | 99.4 /100 | #70 | Exceptional 7.0% |
Demographics Similar to Bermudans by Unemployment Among Women with Children Under 6 years
In terms of unemployment among women with children under 6 years, the demographic groups most similar to Bermudans are Spanish American Indian (8.7%, a difference of 0.020%), Guatemalan (8.7%, a difference of 0.090%), Blackfeet (8.7%, a difference of 0.18%), Immigrants from Belize (8.6%, a difference of 0.23%), and Immigrants from Dominica (8.6%, a difference of 0.27%).
| Demographics | Rating | Rank | Unemployment Among Women with Children Under 6 years |
| Immigrants | Latin America | 0.1 /100 | #275 | Tragic 8.6% |
| Yaqui | 0.0 /100 | #276 | Tragic 8.6% |
| Haitians | 0.0 /100 | #277 | Tragic 8.6% |
| Immigrants | Dominica | 0.0 /100 | #278 | Tragic 8.6% |
| Immigrants | Guatemala | 0.0 /100 | #279 | Tragic 8.6% |
| Immigrants | Belize | 0.0 /100 | #280 | Tragic 8.6% |
| Guatemalans | 0.0 /100 | #281 | Tragic 8.7% |
| Bermudans | 0.0 /100 | #282 | Tragic 8.7% |
| Spanish American Indians | 0.0 /100 | #283 | Tragic 8.7% |
| Blackfeet | 0.0 /100 | #284 | Tragic 8.7% |
| U.S. Virgin Islanders | 0.0 /100 | #285 | Tragic 8.7% |
| Seminole | 0.0 /100 | #286 | Tragic 8.7% |
| Menominee | 0.0 /100 | #287 | Tragic 8.7% |
| Bahamians | 0.0 /100 | #288 | Tragic 8.7% |
| Iroquois | 0.0 /100 | #289 | Tragic 8.7% |