Maltese vs Bulgarian Seniors Poverty Over the Age of 75
COMPARE
Maltese
Bulgarian
Seniors Poverty Over the Age of 75
Seniors Poverty Over the Age of 75 Comparison
Maltese
Bulgarians
10.3%
SENIORS POVERTY OVER THE AGE OF 75
100.0/ 100
METRIC RATING
7th/ 347
METRIC RANK
10.7%
SENIORS POVERTY OVER THE AGE OF 75
99.8/ 100
METRIC RATING
26th/ 347
METRIC RANK
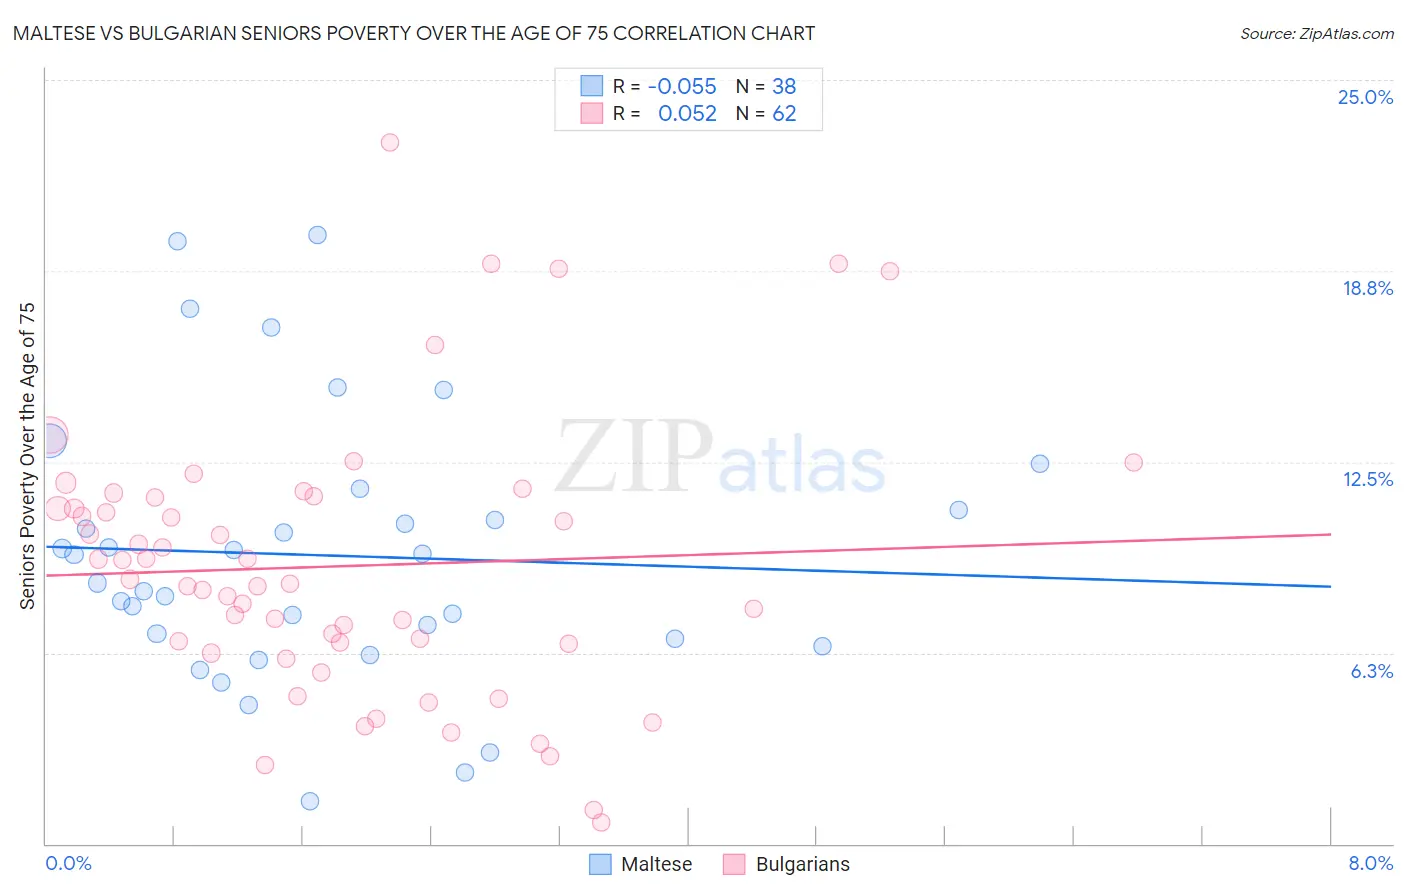
Maltese vs Bulgarian Seniors Poverty Over the Age of 75 Correlation Chart
The statistical analysis conducted on geographies consisting of 126,057,505 people shows a slight negative correlation between the proportion of Maltese and poverty level among seniors over the age of 75 in the United States with a correlation coefficient (R) of -0.055 and weighted average of 10.3%. Similarly, the statistical analysis conducted on geographies consisting of 204,615,916 people shows a slight positive correlation between the proportion of Bulgarians and poverty level among seniors over the age of 75 in the United States with a correlation coefficient (R) of 0.052 and weighted average of 10.7%, a difference of 3.5%.
Seniors Poverty Over the Age of 75 Correlation Summary
| Measurement | Maltese | Bulgarian |
| Minimum | 1.4% | 0.68% |
| Maximum | 19.9% | 23.0% |
| Range | 18.5% | 22.3% |
| Mean | 9.4% | 9.1% |
| Median | 9.0% | 8.6% |
| Interquartile 25% (IQ1) | 6.7% | 6.5% |
| Interquartile 75% (IQ3) | 10.9% | 11.3% |
| Interquartile Range (IQR) | 4.2% | 4.8% |
| Standard Deviation (Sample) | 4.4% | 4.5% |
| Standard Deviation (Population) | 4.3% | 4.5% |
Demographics Similar to Maltese and Bulgarians by Seniors Poverty Over the Age of 75
In terms of seniors poverty over the age of 75, the demographic groups most similar to Maltese are German (10.4%, a difference of 0.58%), Danish (10.2%, a difference of 0.65%), English (10.4%, a difference of 0.92%), Scandinavian (10.4%, a difference of 1.4%), and Immigrants from India (10.4%, a difference of 1.5%). Similarly, the demographic groups most similar to Bulgarians are Menominee (10.6%, a difference of 0.58%), Polish (10.6%, a difference of 0.59%), Lithuanian (10.6%, a difference of 0.66%), Bhutanese (10.6%, a difference of 0.69%), and Slovene (10.6%, a difference of 0.94%).
| Demographics | Rating | Rank | Seniors Poverty Over the Age of 75 |
| Danes | 100.0 /100 | #6 | Exceptional 10.2% |
| Maltese | 100.0 /100 | #7 | Exceptional 10.3% |
| Germans | 99.9 /100 | #8 | Exceptional 10.4% |
| English | 99.9 /100 | #9 | Exceptional 10.4% |
| Scandinavians | 99.9 /100 | #10 | Exceptional 10.4% |
| Immigrants | India | 99.9 /100 | #11 | Exceptional 10.4% |
| Tongans | 99.9 /100 | #12 | Exceptional 10.5% |
| Croatians | 99.9 /100 | #13 | Exceptional 10.5% |
| Scottish | 99.9 /100 | #14 | Exceptional 10.5% |
| Europeans | 99.9 /100 | #15 | Exceptional 10.5% |
| Dutch | 99.9 /100 | #16 | Exceptional 10.5% |
| Slovaks | 99.9 /100 | #17 | Exceptional 10.5% |
| Welsh | 99.9 /100 | #18 | Exceptional 10.5% |
| Immigrants | Scotland | 99.9 /100 | #19 | Exceptional 10.5% |
| Czechs | 99.9 /100 | #20 | Exceptional 10.5% |
| Slovenes | 99.9 /100 | #21 | Exceptional 10.6% |
| Bhutanese | 99.8 /100 | #22 | Exceptional 10.6% |
| Lithuanians | 99.8 /100 | #23 | Exceptional 10.6% |
| Poles | 99.8 /100 | #24 | Exceptional 10.6% |
| Menominee | 99.8 /100 | #25 | Exceptional 10.6% |
| Bulgarians | 99.8 /100 | #26 | Exceptional 10.7% |