Immigrants from Sudan vs Swiss Unemployment
COMPARE
Immigrants from Sudan
Swiss
Unemployment
Unemployment Comparison
Immigrants from Sudan
Swiss
5.0%
UNEMPLOYMENT
96.3/ 100
METRIC RATING
91st/ 347
METRIC RANK
4.5%
UNEMPLOYMENT
100.0/ 100
METRIC RATING
8th/ 347
METRIC RANK
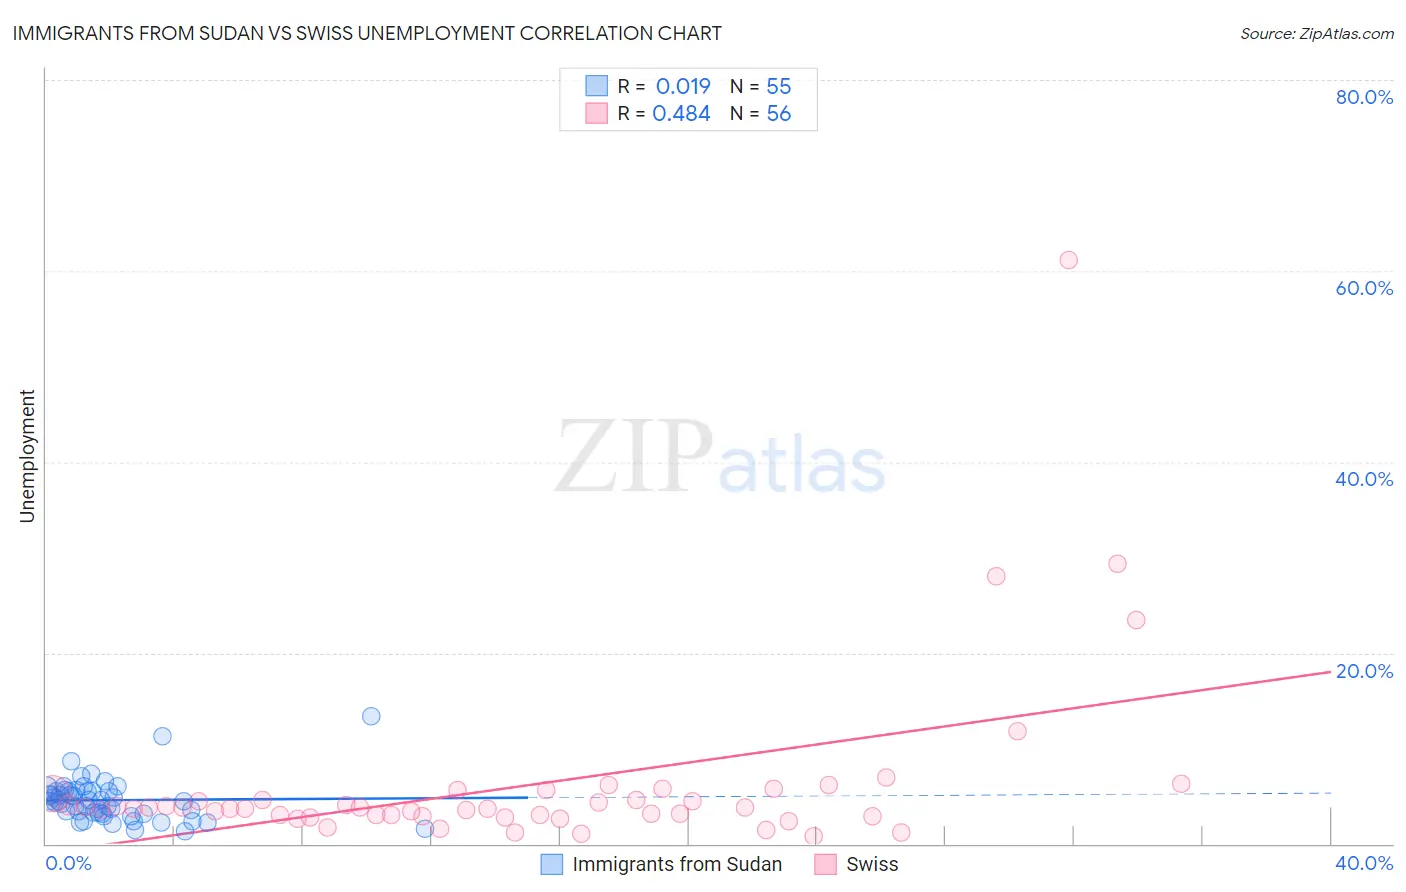
Immigrants from Sudan vs Swiss Unemployment Correlation Chart
The statistical analysis conducted on geographies consisting of 118,944,450 people shows no correlation between the proportion of Immigrants from Sudan and unemployment in the United States with a correlation coefficient (R) of 0.019 and weighted average of 5.0%. Similarly, the statistical analysis conducted on geographies consisting of 463,573,695 people shows a moderate positive correlation between the proportion of Swiss and unemployment in the United States with a correlation coefficient (R) of 0.484 and weighted average of 4.5%, a difference of 10.3%.
Unemployment Correlation Summary
| Measurement | Immigrants from Sudan | Swiss |
| Minimum | 1.3% | 0.84% |
| Maximum | 13.3% | 61.1% |
| Range | 12.0% | 60.3% |
| Mean | 4.6% | 6.1% |
| Median | 4.5% | 3.7% |
| Interquartile 25% (IQ1) | 3.2% | 2.9% |
| Interquartile 75% (IQ3) | 5.5% | 4.9% |
| Interquartile Range (IQR) | 2.3% | 1.9% |
| Standard Deviation (Sample) | 2.2% | 9.3% |
| Standard Deviation (Population) | 2.2% | 9.2% |
Similar Demographics by Unemployment
Demographics Similar to Immigrants from Sudan by Unemployment
In terms of unemployment, the demographic groups most similar to Immigrants from Sudan are Immigrants from North Macedonia (5.0%, a difference of 0.010%), Immigrants from South Africa (5.0%, a difference of 0.020%), Jordanian (5.0%, a difference of 0.050%), Ukrainian (5.0%, a difference of 0.11%), and Immigrants from Korea (5.0%, a difference of 0.14%).
| Demographics | Rating | Rank | Unemployment |
| Russians | 97.4 /100 | #84 | Exceptional 5.0% |
| Immigrants | Australia | 97.0 /100 | #85 | Exceptional 5.0% |
| Hungarians | 96.9 /100 | #86 | Exceptional 5.0% |
| Immigrants | Moldova | 96.6 /100 | #87 | Exceptional 5.0% |
| Immigrants | Korea | 96.6 /100 | #88 | Exceptional 5.0% |
| Jordanians | 96.4 /100 | #89 | Exceptional 5.0% |
| Immigrants | North Macedonia | 96.3 /100 | #90 | Exceptional 5.0% |
| Immigrants | Sudan | 96.3 /100 | #91 | Exceptional 5.0% |
| Immigrants | South Africa | 96.2 /100 | #92 | Exceptional 5.0% |
| Ukrainians | 96.0 /100 | #93 | Exceptional 5.0% |
| Immigrants | Austria | 95.9 /100 | #94 | Exceptional 5.0% |
| Immigrants | Serbia | 95.6 /100 | #95 | Exceptional 5.0% |
| Immigrants | England | 95.2 /100 | #96 | Exceptional 5.0% |
| Immigrants | Czechoslovakia | 95.1 /100 | #97 | Exceptional 5.0% |
| Romanians | 95.0 /100 | #98 | Exceptional 5.0% |
Demographics Similar to Swiss by Unemployment
In terms of unemployment, the demographic groups most similar to Swiss are Scandinavian (4.5%, a difference of 0.39%), Immigrants from India (4.5%, a difference of 0.46%), Dutch (4.6%, a difference of 0.90%), German (4.5%, a difference of 1.0%), and English (4.6%, a difference of 1.6%).
| Demographics | Rating | Rank | Unemployment |
| Norwegians | 100.0 /100 | #1 | Exceptional 4.2% |
| Luxembourgers | 100.0 /100 | #2 | Exceptional 4.3% |
| Czechs | 100.0 /100 | #3 | Exceptional 4.3% |
| Danes | 100.0 /100 | #4 | Exceptional 4.3% |
| Swedes | 100.0 /100 | #5 | Exceptional 4.4% |
| Germans | 100.0 /100 | #6 | Exceptional 4.5% |
| Immigrants | India | 100.0 /100 | #7 | Exceptional 4.5% |
| Swiss | 100.0 /100 | #8 | Exceptional 4.5% |
| Scandinavians | 100.0 /100 | #9 | Exceptional 4.5% |
| Dutch | 100.0 /100 | #10 | Exceptional 4.6% |
| English | 100.0 /100 | #11 | Exceptional 4.6% |
| Pennsylvania Germans | 100.0 /100 | #12 | Exceptional 4.6% |
| Belgians | 100.0 /100 | #13 | Exceptional 4.6% |
| Immigrants | Cuba | 100.0 /100 | #14 | Exceptional 4.6% |
| Europeans | 99.9 /100 | #15 | Exceptional 4.6% |