Luxembourger vs Immigrants from Ukraine Unemployment Among Women with Children Under 6 years
COMPARE
Luxembourger
Immigrants from Ukraine
Unemployment Among Women with Children Under 6 years
Unemployment Among Women with Children Under 6 years Comparison
Luxembourgers
Immigrants from Ukraine
6.6%
UNEMPLOYMENT AMONG WOMEN WITH CHILDREN UNDER 6 YEARS
100.0/ 100
METRIC RATING
36th/ 347
METRIC RANK
6.8%
UNEMPLOYMENT AMONG WOMEN WITH CHILDREN UNDER 6 YEARS
99.8/ 100
METRIC RATING
55th/ 347
METRIC RANK
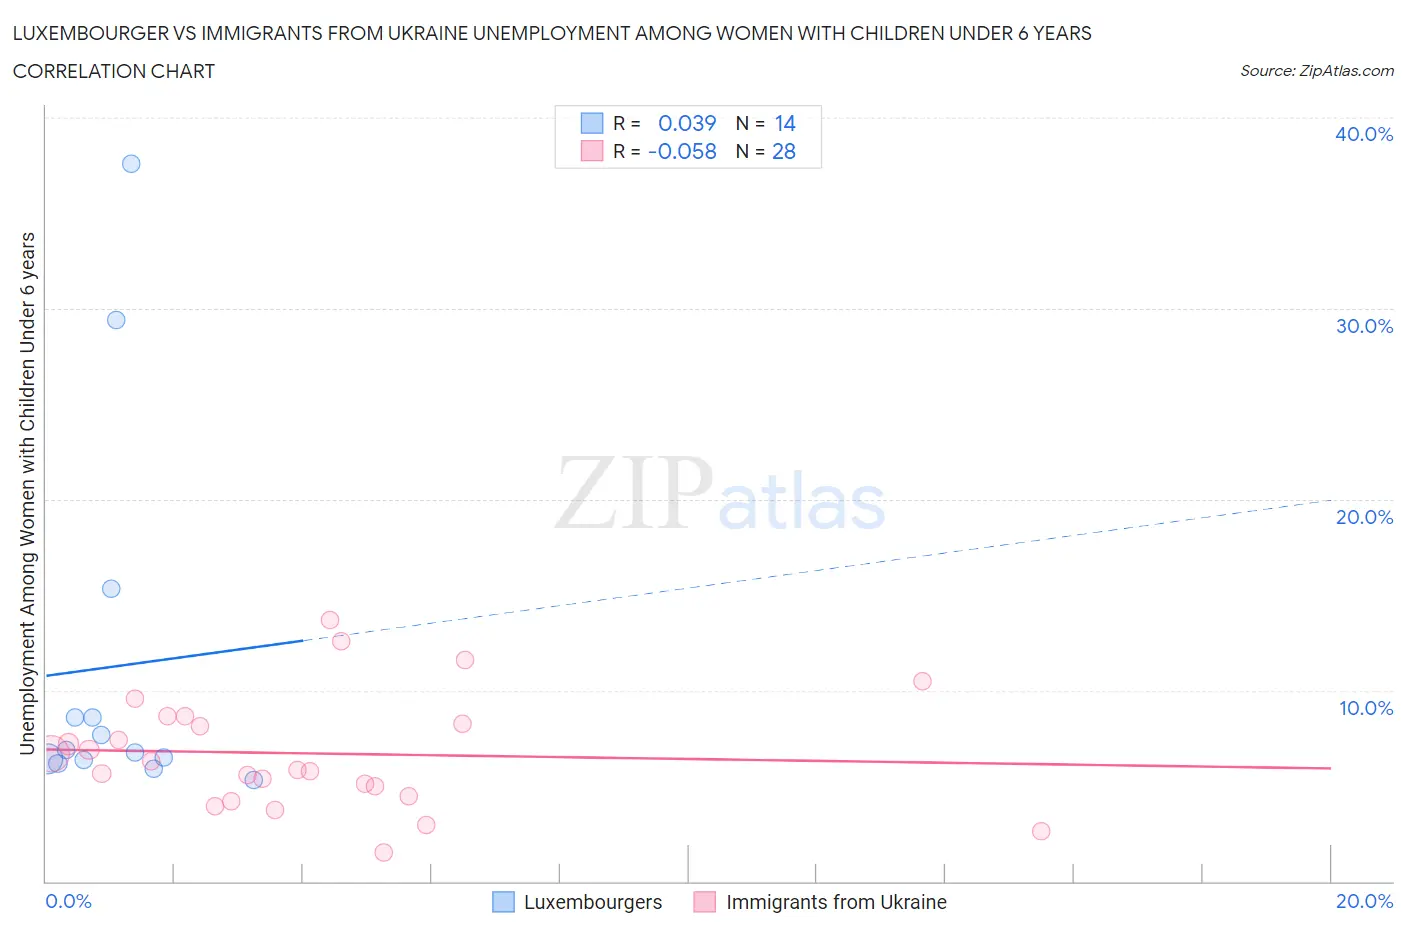
Luxembourger vs Immigrants from Ukraine Unemployment Among Women with Children Under 6 years Correlation Chart
The statistical analysis conducted on geographies consisting of 119,873,666 people shows no correlation between the proportion of Luxembourgers and unemployment rate among women with children under the age of 6 in the United States with a correlation coefficient (R) of 0.039 and weighted average of 6.6%. Similarly, the statistical analysis conducted on geographies consisting of 229,379,274 people shows a slight negative correlation between the proportion of Immigrants from Ukraine and unemployment rate among women with children under the age of 6 in the United States with a correlation coefficient (R) of -0.058 and weighted average of 6.8%, a difference of 3.2%.
Unemployment Among Women with Children Under 6 years Correlation Summary
| Measurement | Luxembourger | Immigrants from Ukraine |
| Minimum | 5.3% | 1.5% |
| Maximum | 37.6% | 13.7% |
| Range | 32.3% | 12.2% |
| Mean | 11.2% | 6.7% |
| Median | 6.8% | 6.0% |
| Interquartile 25% (IQ1) | 6.4% | 4.7% |
| Interquartile 75% (IQ3) | 8.6% | 8.4% |
| Interquartile Range (IQR) | 2.2% | 3.7% |
| Standard Deviation (Sample) | 9.9% | 3.0% |
| Standard Deviation (Population) | 9.5% | 2.9% |
Demographics Similar to Luxembourgers and Immigrants from Ukraine by Unemployment Among Women with Children Under 6 years
In terms of unemployment among women with children under 6 years, the demographic groups most similar to Luxembourgers are Yakama (6.6%, a difference of 0.070%), Sri Lankan (6.6%, a difference of 0.25%), Hmong (6.7%, a difference of 0.38%), Immigrants from Russia (6.7%, a difference of 0.45%), and Asian (6.7%, a difference of 0.67%). Similarly, the demographic groups most similar to Immigrants from Ukraine are Immigrants from Latvia (6.8%, a difference of 0.49%), Chinese (6.8%, a difference of 0.67%), Immigrants from Iran (6.8%, a difference of 0.74%), Ethiopian (6.8%, a difference of 0.86%), and Immigrants from Ireland (6.8%, a difference of 0.87%).
| Demographics | Rating | Rank | Unemployment Among Women with Children Under 6 years |
| Yakama | 100.0 /100 | #35 | Exceptional 6.6% |
| Luxembourgers | 100.0 /100 | #36 | Exceptional 6.6% |
| Sri Lankans | 100.0 /100 | #37 | Exceptional 6.6% |
| Hmong | 100.0 /100 | #38 | Exceptional 6.7% |
| Immigrants | Russia | 100.0 /100 | #39 | Exceptional 6.7% |
| Asians | 100.0 /100 | #40 | Exceptional 6.7% |
| Immigrants | Indonesia | 99.9 /100 | #41 | Exceptional 6.7% |
| Immigrants | Cuba | 99.9 /100 | #42 | Exceptional 6.7% |
| Bhutanese | 99.9 /100 | #43 | Exceptional 6.7% |
| Iranians | 99.9 /100 | #44 | Exceptional 6.7% |
| Immigrants | Australia | 99.9 /100 | #45 | Exceptional 6.8% |
| Latvians | 99.9 /100 | #46 | Exceptional 6.8% |
| Immigrants | Asia | 99.9 /100 | #47 | Exceptional 6.8% |
| Immigrants | Switzerland | 99.9 /100 | #48 | Exceptional 6.8% |
| Immigrants | Nepal | 99.9 /100 | #49 | Exceptional 6.8% |
| Immigrants | Ireland | 99.9 /100 | #50 | Exceptional 6.8% |
| Ethiopians | 99.9 /100 | #51 | Exceptional 6.8% |
| Immigrants | Iran | 99.9 /100 | #52 | Exceptional 6.8% |
| Chinese | 99.9 /100 | #53 | Exceptional 6.8% |
| Immigrants | Latvia | 99.9 /100 | #54 | Exceptional 6.8% |
| Immigrants | Ukraine | 99.8 /100 | #55 | Exceptional 6.8% |