Immigrants from Uzbekistan vs Immigrants from Ukraine Unemployment Among Women with Children Under 6 years
COMPARE
Immigrants from Uzbekistan
Immigrants from Ukraine
Unemployment Among Women with Children Under 6 years
Unemployment Among Women with Children Under 6 years Comparison
Immigrants from Uzbekistan
Immigrants from Ukraine
6.3%
UNEMPLOYMENT AMONG WOMEN WITH CHILDREN UNDER 6 YEARS
100.0/ 100
METRIC RATING
16th/ 347
METRIC RANK
6.8%
UNEMPLOYMENT AMONG WOMEN WITH CHILDREN UNDER 6 YEARS
99.8/ 100
METRIC RATING
55th/ 347
METRIC RANK
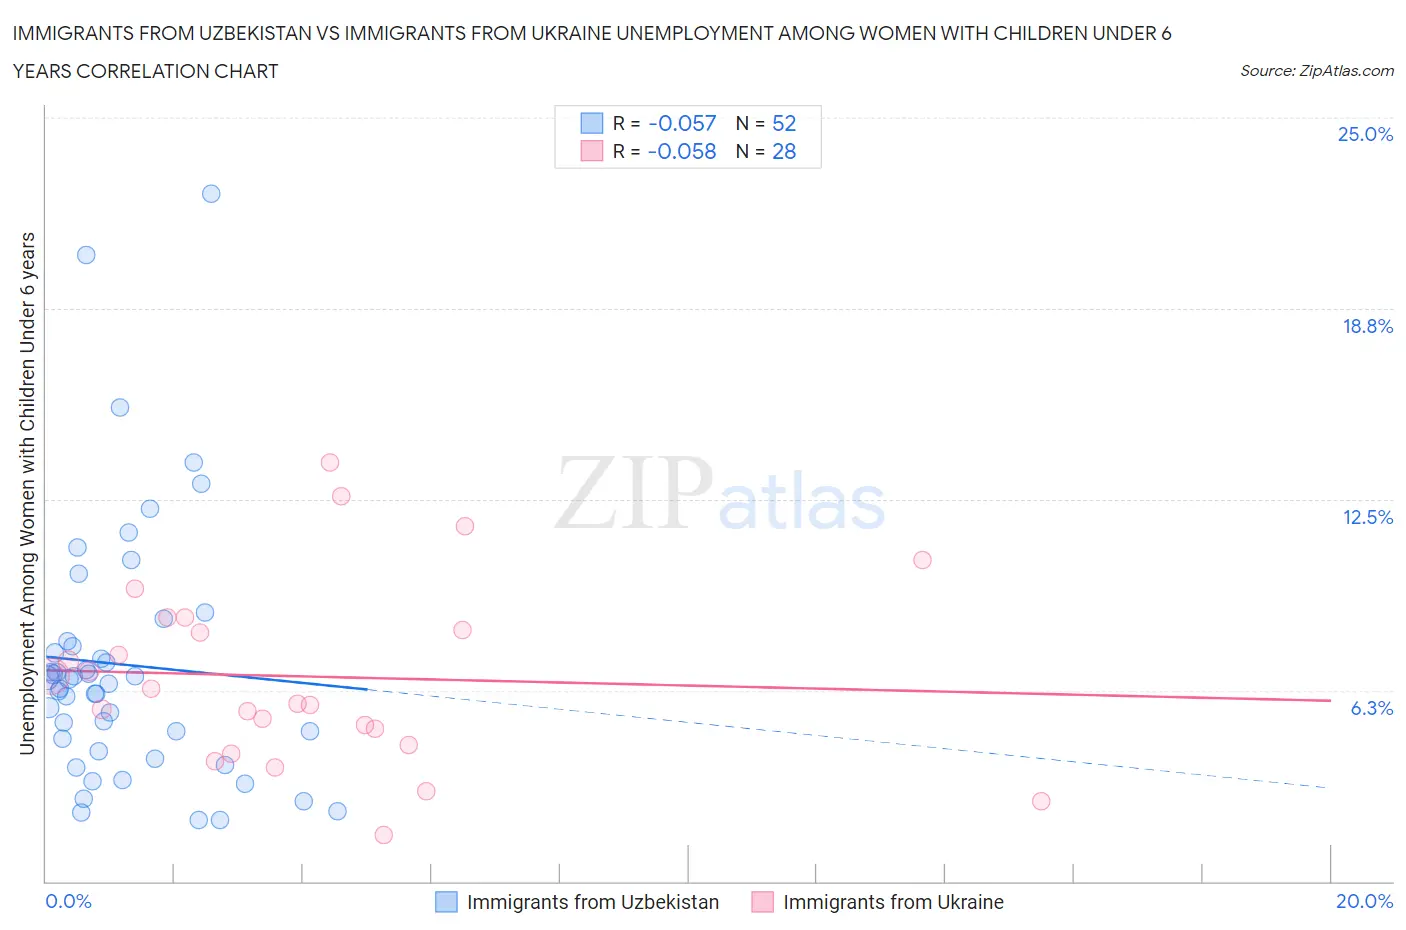
Immigrants from Uzbekistan vs Immigrants from Ukraine Unemployment Among Women with Children Under 6 years Correlation Chart
The statistical analysis conducted on geographies consisting of 105,202,547 people shows a slight negative correlation between the proportion of Immigrants from Uzbekistan and unemployment rate among women with children under the age of 6 in the United States with a correlation coefficient (R) of -0.057 and weighted average of 6.3%. Similarly, the statistical analysis conducted on geographies consisting of 229,379,274 people shows a slight negative correlation between the proportion of Immigrants from Ukraine and unemployment rate among women with children under the age of 6 in the United States with a correlation coefficient (R) of -0.058 and weighted average of 6.8%, a difference of 7.8%.
Unemployment Among Women with Children Under 6 years Correlation Summary
| Measurement | Immigrants from Uzbekistan | Immigrants from Ukraine |
| Minimum | 2.0% | 1.5% |
| Maximum | 22.5% | 13.7% |
| Range | 20.5% | 12.2% |
| Mean | 7.1% | 6.7% |
| Median | 6.6% | 6.0% |
| Interquartile 25% (IQ1) | 4.5% | 4.7% |
| Interquartile 75% (IQ3) | 7.8% | 8.4% |
| Interquartile Range (IQR) | 3.3% | 3.7% |
| Standard Deviation (Sample) | 4.2% | 3.0% |
| Standard Deviation (Population) | 4.2% | 2.9% |
Similar Demographics by Unemployment Among Women with Children Under 6 years
Demographics Similar to Immigrants from Uzbekistan by Unemployment Among Women with Children Under 6 years
In terms of unemployment among women with children under 6 years, the demographic groups most similar to Immigrants from Uzbekistan are Thai (6.3%, a difference of 0.30%), Immigrants from Bulgaria (6.3%, a difference of 0.40%), Immigrants from Malaysia (6.4%, a difference of 0.67%), Immigrants from Eastern Asia (6.3%, a difference of 0.72%), and Immigrants from Singapore (6.3%, a difference of 0.78%).
| Demographics | Rating | Rank | Unemployment Among Women with Children Under 6 years |
| Filipinos | 100.0 /100 | #9 | Exceptional 6.1% |
| Immigrants | China | 100.0 /100 | #10 | Exceptional 6.2% |
| Indians (Asian) | 100.0 /100 | #11 | Exceptional 6.3% |
| Immigrants | Singapore | 100.0 /100 | #12 | Exceptional 6.3% |
| Immigrants | Eastern Asia | 100.0 /100 | #13 | Exceptional 6.3% |
| Immigrants | Bulgaria | 100.0 /100 | #14 | Exceptional 6.3% |
| Thais | 100.0 /100 | #15 | Exceptional 6.3% |
| Immigrants | Uzbekistan | 100.0 /100 | #16 | Exceptional 6.3% |
| Immigrants | Malaysia | 100.0 /100 | #17 | Exceptional 6.4% |
| Assyrians/Chaldeans/Syriacs | 100.0 /100 | #18 | Exceptional 6.5% |
| Mongolians | 100.0 /100 | #19 | Exceptional 6.5% |
| Ute | 100.0 /100 | #20 | Exceptional 6.5% |
| Burmese | 100.0 /100 | #21 | Exceptional 6.5% |
| Immigrants | Korea | 100.0 /100 | #22 | Exceptional 6.5% |
| Bulgarians | 100.0 /100 | #23 | Exceptional 6.5% |
Demographics Similar to Immigrants from Ukraine by Unemployment Among Women with Children Under 6 years
In terms of unemployment among women with children under 6 years, the demographic groups most similar to Immigrants from Ukraine are Immigrants from Ethiopia (6.9%, a difference of 0.10%), Icelander (6.9%, a difference of 0.11%), Immigrants from Turkey (6.9%, a difference of 0.34%), Immigrants from Serbia (6.9%, a difference of 0.40%), and Immigrants from Sri Lanka (6.9%, a difference of 0.48%).
| Demographics | Rating | Rank | Unemployment Among Women with Children Under 6 years |
| Immigrants | Switzerland | 99.9 /100 | #48 | Exceptional 6.8% |
| Immigrants | Nepal | 99.9 /100 | #49 | Exceptional 6.8% |
| Immigrants | Ireland | 99.9 /100 | #50 | Exceptional 6.8% |
| Ethiopians | 99.9 /100 | #51 | Exceptional 6.8% |
| Immigrants | Iran | 99.9 /100 | #52 | Exceptional 6.8% |
| Chinese | 99.9 /100 | #53 | Exceptional 6.8% |
| Immigrants | Latvia | 99.9 /100 | #54 | Exceptional 6.8% |
| Immigrants | Ukraine | 99.8 /100 | #55 | Exceptional 6.8% |
| Immigrants | Ethiopia | 99.8 /100 | #56 | Exceptional 6.9% |
| Icelanders | 99.8 /100 | #57 | Exceptional 6.9% |
| Immigrants | Turkey | 99.8 /100 | #58 | Exceptional 6.9% |
| Immigrants | Serbia | 99.8 /100 | #59 | Exceptional 6.9% |
| Immigrants | Sri Lanka | 99.8 /100 | #60 | Exceptional 6.9% |
| Immigrants | France | 99.7 /100 | #61 | Exceptional 6.9% |
| Somalis | 99.7 /100 | #62 | Exceptional 6.9% |