Luxembourger vs Immigrants from Uganda Unemployment Among Women with Children Under 6 years
COMPARE
Luxembourger
Immigrants from Uganda
Unemployment Among Women with Children Under 6 years
Unemployment Among Women with Children Under 6 years Comparison
Luxembourgers
Immigrants from Uganda
6.6%
UNEMPLOYMENT AMONG WOMEN WITH CHILDREN UNDER 6 YEARS
100.0/ 100
METRIC RATING
36th/ 347
METRIC RANK
7.4%
UNEMPLOYMENT AMONG WOMEN WITH CHILDREN UNDER 6 YEARS
86.5/ 100
METRIC RATING
133rd/ 347
METRIC RANK
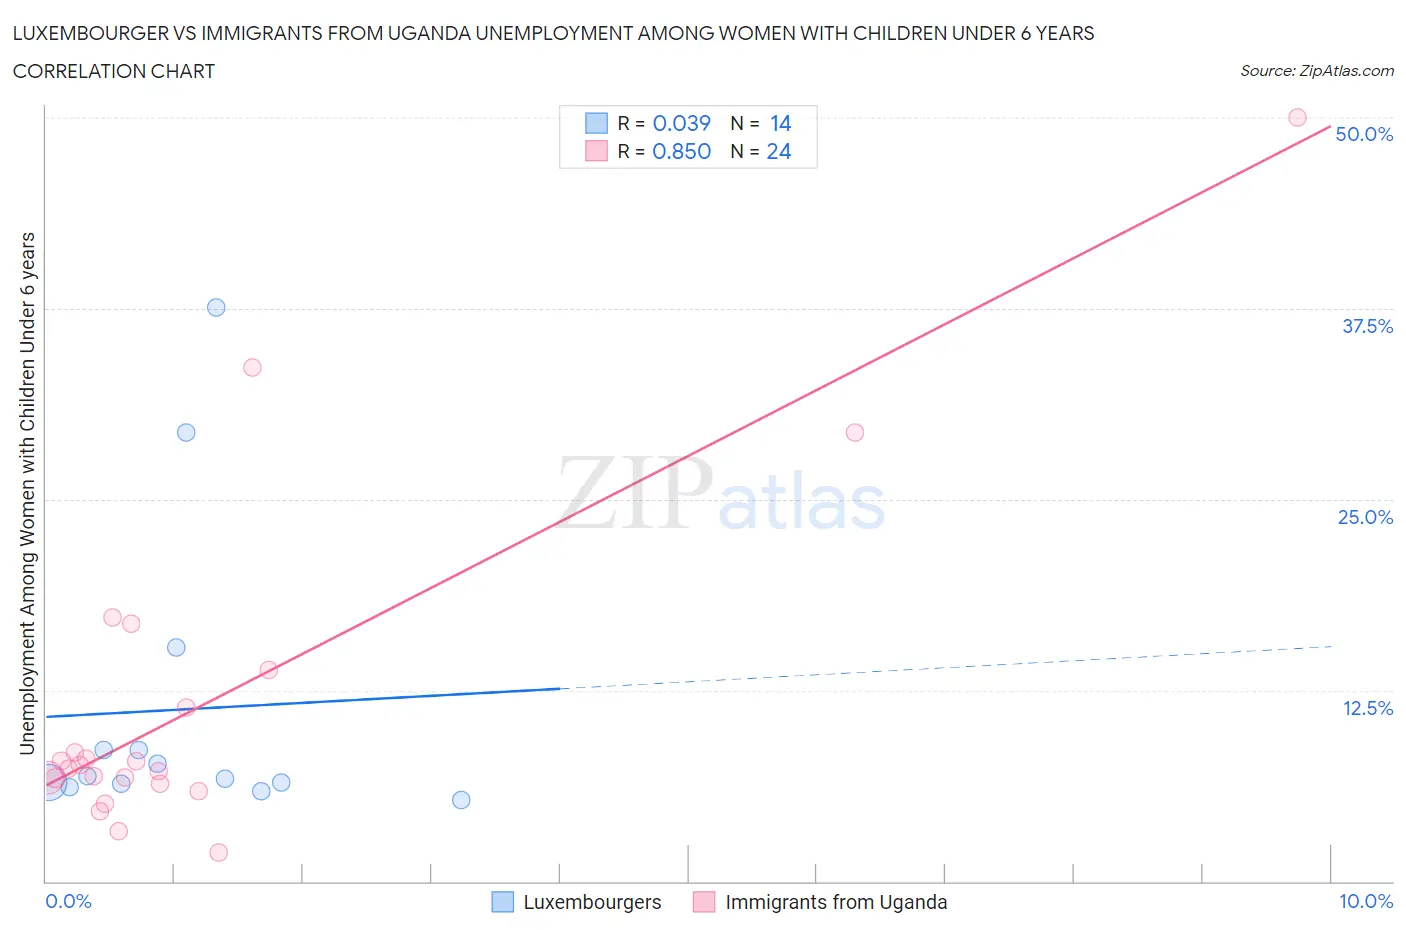
Luxembourger vs Immigrants from Uganda Unemployment Among Women with Children Under 6 years Correlation Chart
The statistical analysis conducted on geographies consisting of 119,873,666 people shows no correlation between the proportion of Luxembourgers and unemployment rate among women with children under the age of 6 in the United States with a correlation coefficient (R) of 0.039 and weighted average of 6.6%. Similarly, the statistical analysis conducted on geographies consisting of 112,668,126 people shows a very strong positive correlation between the proportion of Immigrants from Uganda and unemployment rate among women with children under the age of 6 in the United States with a correlation coefficient (R) of 0.850 and weighted average of 7.4%, a difference of 11.8%.
Unemployment Among Women with Children Under 6 years Correlation Summary
| Measurement | Luxembourger | Immigrants from Uganda |
| Minimum | 5.3% | 1.9% |
| Maximum | 37.6% | 50.0% |
| Range | 32.3% | 48.1% |
| Mean | 11.2% | 11.7% |
| Median | 6.8% | 7.5% |
| Interquartile 25% (IQ1) | 6.4% | 6.6% |
| Interquartile 75% (IQ3) | 8.6% | 12.6% |
| Interquartile Range (IQR) | 2.2% | 6.0% |
| Standard Deviation (Sample) | 9.9% | 11.1% |
| Standard Deviation (Population) | 9.5% | 10.9% |
Similar Demographics by Unemployment Among Women with Children Under 6 years
Demographics Similar to Luxembourgers by Unemployment Among Women with Children Under 6 years
In terms of unemployment among women with children under 6 years, the demographic groups most similar to Luxembourgers are Yakama (6.6%, a difference of 0.070%), Sri Lankan (6.6%, a difference of 0.25%), Immigrants from Vietnam (6.6%, a difference of 0.34%), Immigrants from South Central Asia (6.6%, a difference of 0.34%), and Tsimshian (6.6%, a difference of 0.36%).
| Demographics | Rating | Rank | Unemployment Among Women with Children Under 6 years |
| Immigrants | Sweden | 100.0 /100 | #29 | Exceptional 6.6% |
| Immigrants | Belarus | 100.0 /100 | #30 | Exceptional 6.6% |
| Immigrants | Moldova | 100.0 /100 | #31 | Exceptional 6.6% |
| Tsimshian | 100.0 /100 | #32 | Exceptional 6.6% |
| Immigrants | Vietnam | 100.0 /100 | #33 | Exceptional 6.6% |
| Immigrants | South Central Asia | 100.0 /100 | #34 | Exceptional 6.6% |
| Yakama | 100.0 /100 | #35 | Exceptional 6.6% |
| Luxembourgers | 100.0 /100 | #36 | Exceptional 6.6% |
| Sri Lankans | 100.0 /100 | #37 | Exceptional 6.6% |
| Hmong | 100.0 /100 | #38 | Exceptional 6.7% |
| Immigrants | Russia | 100.0 /100 | #39 | Exceptional 6.7% |
| Asians | 100.0 /100 | #40 | Exceptional 6.7% |
| Immigrants | Indonesia | 99.9 /100 | #41 | Exceptional 6.7% |
| Immigrants | Cuba | 99.9 /100 | #42 | Exceptional 6.7% |
| Bhutanese | 99.9 /100 | #43 | Exceptional 6.7% |
Demographics Similar to Immigrants from Uganda by Unemployment Among Women with Children Under 6 years
In terms of unemployment among women with children under 6 years, the demographic groups most similar to Immigrants from Uganda are Immigrants from Bolivia (7.4%, a difference of 0.11%), Immigrants from Armenia (7.4%, a difference of 0.12%), Immigrants from Northern Africa (7.4%, a difference of 0.17%), Immigrants from Morocco (7.4%, a difference of 0.23%), and Ukrainian (7.4%, a difference of 0.25%).
| Demographics | Rating | Rank | Unemployment Among Women with Children Under 6 years |
| Immigrants | Burma/Myanmar | 91.9 /100 | #126 | Exceptional 7.3% |
| Jordanians | 91.5 /100 | #127 | Exceptional 7.3% |
| Zimbabweans | 91.5 /100 | #128 | Exceptional 7.3% |
| Slovenes | 89.2 /100 | #129 | Excellent 7.4% |
| Swedes | 88.4 /100 | #130 | Excellent 7.4% |
| Ukrainians | 88.2 /100 | #131 | Excellent 7.4% |
| Immigrants | Armenia | 87.4 /100 | #132 | Excellent 7.4% |
| Immigrants | Uganda | 86.5 /100 | #133 | Excellent 7.4% |
| Immigrants | Bolivia | 85.7 /100 | #134 | Excellent 7.4% |
| Immigrants | Northern Africa | 85.3 /100 | #135 | Excellent 7.4% |
| Immigrants | Morocco | 84.9 /100 | #136 | Excellent 7.4% |
| Immigrants | Cambodia | 84.6 /100 | #137 | Excellent 7.4% |
| Immigrants | Norway | 84.1 /100 | #138 | Excellent 7.4% |
| Immigrants | Colombia | 83.9 /100 | #139 | Excellent 7.4% |
| Scandinavians | 83.0 /100 | #140 | Excellent 7.4% |