Luxembourger vs Immigrants from Portugal Unemployment Among Women with Children Under 6 years
COMPARE
Luxembourger
Immigrants from Portugal
Unemployment Among Women with Children Under 6 years
Unemployment Among Women with Children Under 6 years Comparison
Luxembourgers
Immigrants from Portugal
6.6%
UNEMPLOYMENT AMONG WOMEN WITH CHILDREN UNDER 6 YEARS
100.0/ 100
METRIC RATING
36th/ 347
METRIC RANK
8.3%
UNEMPLOYMENT AMONG WOMEN WITH CHILDREN UNDER 6 YEARS
0.6/ 100
METRIC RATING
255th/ 347
METRIC RANK
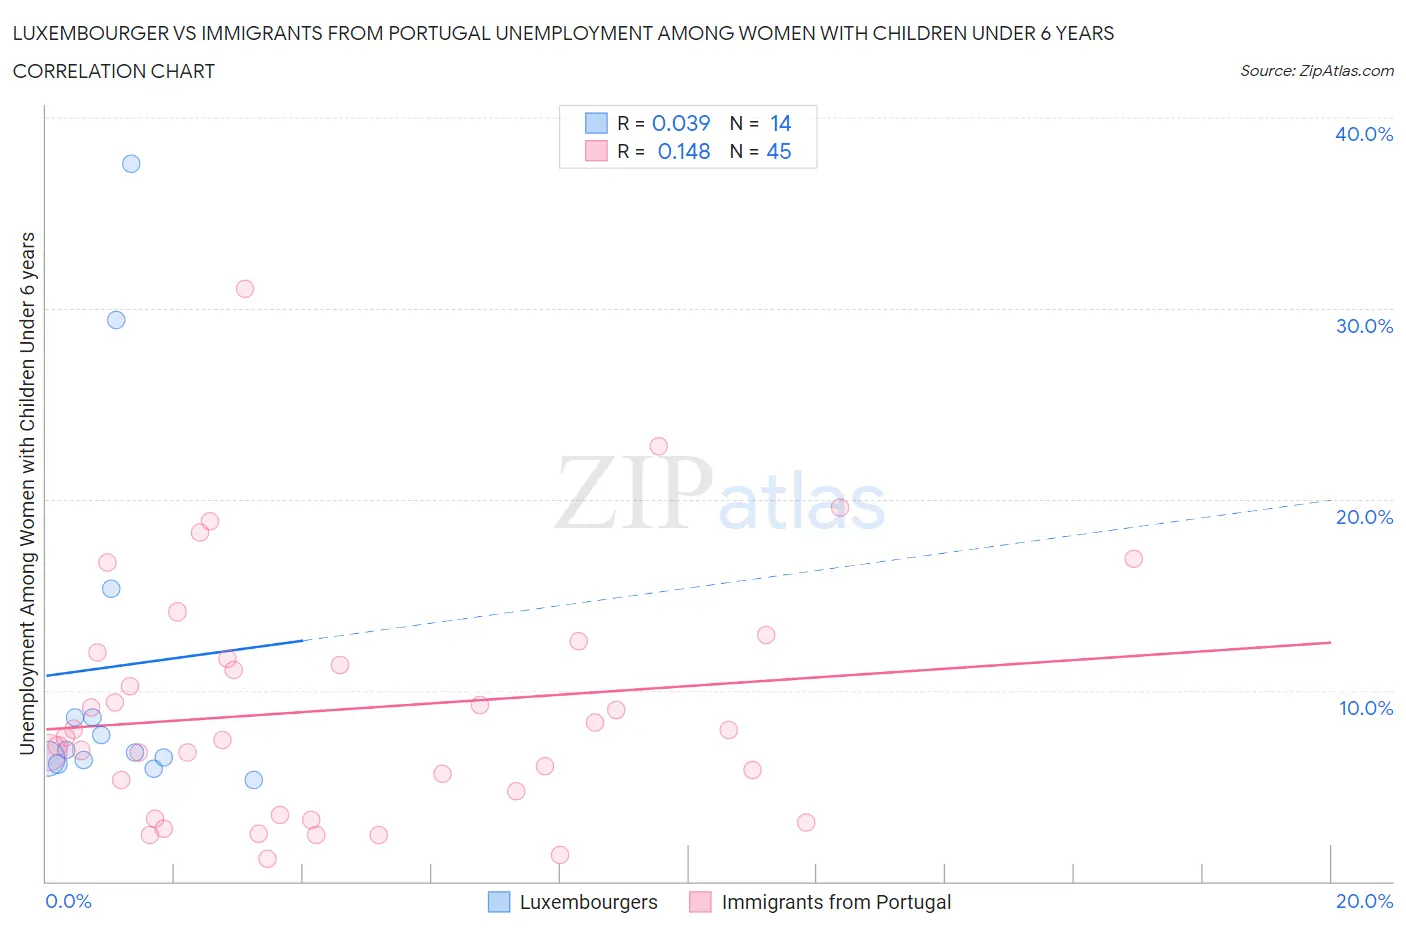
Luxembourger vs Immigrants from Portugal Unemployment Among Women with Children Under 6 years Correlation Chart
The statistical analysis conducted on geographies consisting of 119,873,666 people shows no correlation between the proportion of Luxembourgers and unemployment rate among women with children under the age of 6 in the United States with a correlation coefficient (R) of 0.039 and weighted average of 6.6%. Similarly, the statistical analysis conducted on geographies consisting of 145,443,316 people shows a poor positive correlation between the proportion of Immigrants from Portugal and unemployment rate among women with children under the age of 6 in the United States with a correlation coefficient (R) of 0.148 and weighted average of 8.3%, a difference of 25.1%.
Unemployment Among Women with Children Under 6 years Correlation Summary
| Measurement | Luxembourger | Immigrants from Portugal |
| Minimum | 5.3% | 1.2% |
| Maximum | 37.6% | 31.0% |
| Range | 32.3% | 29.8% |
| Mean | 11.2% | 9.0% |
| Median | 6.8% | 7.5% |
| Interquartile 25% (IQ1) | 6.4% | 4.1% |
| Interquartile 75% (IQ3) | 8.6% | 11.8% |
| Interquartile Range (IQR) | 2.2% | 7.7% |
| Standard Deviation (Sample) | 9.9% | 6.3% |
| Standard Deviation (Population) | 9.5% | 6.2% |
Similar Demographics by Unemployment Among Women with Children Under 6 years
Demographics Similar to Luxembourgers by Unemployment Among Women with Children Under 6 years
In terms of unemployment among women with children under 6 years, the demographic groups most similar to Luxembourgers are Yakama (6.6%, a difference of 0.070%), Sri Lankan (6.6%, a difference of 0.25%), Immigrants from Vietnam (6.6%, a difference of 0.34%), Immigrants from South Central Asia (6.6%, a difference of 0.34%), and Tsimshian (6.6%, a difference of 0.36%).
| Demographics | Rating | Rank | Unemployment Among Women with Children Under 6 years |
| Immigrants | Sweden | 100.0 /100 | #29 | Exceptional 6.6% |
| Immigrants | Belarus | 100.0 /100 | #30 | Exceptional 6.6% |
| Immigrants | Moldova | 100.0 /100 | #31 | Exceptional 6.6% |
| Tsimshian | 100.0 /100 | #32 | Exceptional 6.6% |
| Immigrants | Vietnam | 100.0 /100 | #33 | Exceptional 6.6% |
| Immigrants | South Central Asia | 100.0 /100 | #34 | Exceptional 6.6% |
| Yakama | 100.0 /100 | #35 | Exceptional 6.6% |
| Luxembourgers | 100.0 /100 | #36 | Exceptional 6.6% |
| Sri Lankans | 100.0 /100 | #37 | Exceptional 6.6% |
| Hmong | 100.0 /100 | #38 | Exceptional 6.7% |
| Immigrants | Russia | 100.0 /100 | #39 | Exceptional 6.7% |
| Asians | 100.0 /100 | #40 | Exceptional 6.7% |
| Immigrants | Indonesia | 99.9 /100 | #41 | Exceptional 6.7% |
| Immigrants | Cuba | 99.9 /100 | #42 | Exceptional 6.7% |
| Bhutanese | 99.9 /100 | #43 | Exceptional 6.7% |
Demographics Similar to Immigrants from Portugal by Unemployment Among Women with Children Under 6 years
In terms of unemployment among women with children under 6 years, the demographic groups most similar to Immigrants from Portugal are Celtic (8.3%, a difference of 0.020%), British West Indian (8.3%, a difference of 0.27%), Immigrants from Caribbean (8.3%, a difference of 0.29%), Immigrants from Ghana (8.3%, a difference of 0.30%), and Immigrants from Guyana (8.2%, a difference of 0.56%).
| Demographics | Rating | Rank | Unemployment Among Women with Children Under 6 years |
| Immigrants | Western Africa | 1.1 /100 | #248 | Tragic 8.2% |
| Immigrants | Sierra Leone | 1.1 /100 | #249 | Tragic 8.2% |
| Nigerians | 1.1 /100 | #250 | Tragic 8.2% |
| Guyanese | 1.0 /100 | #251 | Tragic 8.2% |
| Ghanaians | 1.0 /100 | #252 | Tragic 8.2% |
| Immigrants | Guyana | 0.8 /100 | #253 | Tragic 8.2% |
| Immigrants | Caribbean | 0.7 /100 | #254 | Tragic 8.3% |
| Immigrants | Portugal | 0.6 /100 | #255 | Tragic 8.3% |
| Celtics | 0.6 /100 | #256 | Tragic 8.3% |
| British West Indians | 0.5 /100 | #257 | Tragic 8.3% |
| Immigrants | Ghana | 0.5 /100 | #258 | Tragic 8.3% |
| Barbadians | 0.4 /100 | #259 | Tragic 8.3% |
| Whites/Caucasians | 0.3 /100 | #260 | Tragic 8.4% |
| Immigrants | Liberia | 0.3 /100 | #261 | Tragic 8.4% |
| West Indians | 0.3 /100 | #262 | Tragic 8.4% |