Immigrants from Hong Kong vs Immigrants from Ukraine Unemployment Among Women with Children Under 6 years
COMPARE
Immigrants from Hong Kong
Immigrants from Ukraine
Unemployment Among Women with Children Under 6 years
Unemployment Among Women with Children Under 6 years Comparison
Immigrants from Hong Kong
Immigrants from Ukraine
5.8%
UNEMPLOYMENT AMONG WOMEN WITH CHILDREN UNDER 6 YEARS
100.0/ 100
METRIC RATING
2nd/ 347
METRIC RANK
6.8%
UNEMPLOYMENT AMONG WOMEN WITH CHILDREN UNDER 6 YEARS
99.8/ 100
METRIC RATING
55th/ 347
METRIC RANK
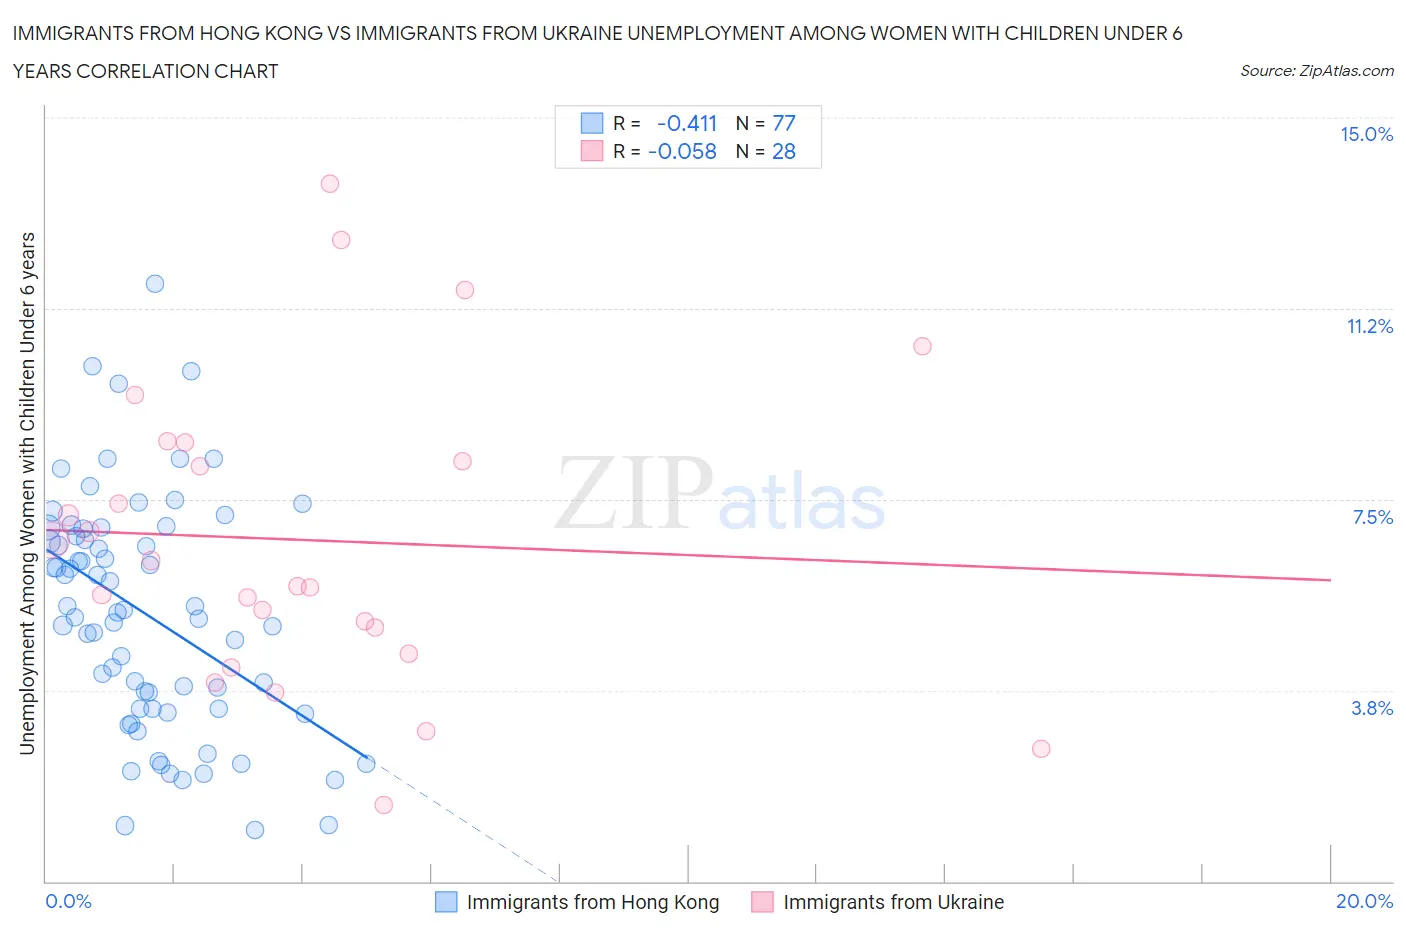
Immigrants from Hong Kong vs Immigrants from Ukraine Unemployment Among Women with Children Under 6 years Correlation Chart
The statistical analysis conducted on geographies consisting of 208,576,237 people shows a moderate negative correlation between the proportion of Immigrants from Hong Kong and unemployment rate among women with children under the age of 6 in the United States with a correlation coefficient (R) of -0.411 and weighted average of 5.8%. Similarly, the statistical analysis conducted on geographies consisting of 229,379,274 people shows a slight negative correlation between the proportion of Immigrants from Ukraine and unemployment rate among women with children under the age of 6 in the United States with a correlation coefficient (R) of -0.058 and weighted average of 6.8%, a difference of 18.3%.
Unemployment Among Women with Children Under 6 years Correlation Summary
| Measurement | Immigrants from Hong Kong | Immigrants from Ukraine |
| Minimum | 1.0% | 1.5% |
| Maximum | 11.7% | 13.7% |
| Range | 10.7% | 12.2% |
| Mean | 5.2% | 6.7% |
| Median | 5.3% | 6.0% |
| Interquartile 25% (IQ1) | 3.4% | 4.7% |
| Interquartile 75% (IQ3) | 6.9% | 8.4% |
| Interquartile Range (IQR) | 3.5% | 3.7% |
| Standard Deviation (Sample) | 2.3% | 3.0% |
| Standard Deviation (Population) | 2.3% | 2.9% |
Similar Demographics by Unemployment Among Women with Children Under 6 years
Demographics Similar to Immigrants from Hong Kong by Unemployment Among Women with Children Under 6 years
In terms of unemployment among women with children under 6 years, the demographic groups most similar to Immigrants from Hong Kong are Okinawan (5.8%, a difference of 0.87%), Cambodian (5.9%, a difference of 1.8%), Cape Verdean (5.9%, a difference of 2.8%), Immigrants from Taiwan (6.0%, a difference of 4.5%), and Taiwanese (6.1%, a difference of 5.1%).
| Demographics | Rating | Rank | Unemployment Among Women with Children Under 6 years |
| Immigrants | Cabo Verde | 100.0 /100 | #1 | Exceptional 5.4% |
| Immigrants | Hong Kong | 100.0 /100 | #2 | Exceptional 5.8% |
| Okinawans | 100.0 /100 | #3 | Exceptional 5.8% |
| Cambodians | 100.0 /100 | #4 | Exceptional 5.9% |
| Cape Verdeans | 100.0 /100 | #5 | Exceptional 5.9% |
| Immigrants | Taiwan | 100.0 /100 | #6 | Exceptional 6.0% |
| Taiwanese | 100.0 /100 | #7 | Exceptional 6.1% |
| Immigrants | India | 100.0 /100 | #8 | Exceptional 6.1% |
| Filipinos | 100.0 /100 | #9 | Exceptional 6.1% |
| Immigrants | China | 100.0 /100 | #10 | Exceptional 6.2% |
| Indians (Asian) | 100.0 /100 | #11 | Exceptional 6.3% |
| Immigrants | Singapore | 100.0 /100 | #12 | Exceptional 6.3% |
| Immigrants | Eastern Asia | 100.0 /100 | #13 | Exceptional 6.3% |
| Immigrants | Bulgaria | 100.0 /100 | #14 | Exceptional 6.3% |
| Thais | 100.0 /100 | #15 | Exceptional 6.3% |
Demographics Similar to Immigrants from Ukraine by Unemployment Among Women with Children Under 6 years
In terms of unemployment among women with children under 6 years, the demographic groups most similar to Immigrants from Ukraine are Immigrants from Ethiopia (6.9%, a difference of 0.10%), Icelander (6.9%, a difference of 0.11%), Immigrants from Turkey (6.9%, a difference of 0.34%), Immigrants from Serbia (6.9%, a difference of 0.40%), and Immigrants from Sri Lanka (6.9%, a difference of 0.48%).
| Demographics | Rating | Rank | Unemployment Among Women with Children Under 6 years |
| Immigrants | Switzerland | 99.9 /100 | #48 | Exceptional 6.8% |
| Immigrants | Nepal | 99.9 /100 | #49 | Exceptional 6.8% |
| Immigrants | Ireland | 99.9 /100 | #50 | Exceptional 6.8% |
| Ethiopians | 99.9 /100 | #51 | Exceptional 6.8% |
| Immigrants | Iran | 99.9 /100 | #52 | Exceptional 6.8% |
| Chinese | 99.9 /100 | #53 | Exceptional 6.8% |
| Immigrants | Latvia | 99.9 /100 | #54 | Exceptional 6.8% |
| Immigrants | Ukraine | 99.8 /100 | #55 | Exceptional 6.8% |
| Immigrants | Ethiopia | 99.8 /100 | #56 | Exceptional 6.9% |
| Icelanders | 99.8 /100 | #57 | Exceptional 6.9% |
| Immigrants | Turkey | 99.8 /100 | #58 | Exceptional 6.9% |
| Immigrants | Serbia | 99.8 /100 | #59 | Exceptional 6.9% |
| Immigrants | Sri Lanka | 99.8 /100 | #60 | Exceptional 6.9% |
| Immigrants | France | 99.7 /100 | #61 | Exceptional 6.9% |
| Somalis | 99.7 /100 | #62 | Exceptional 6.9% |