Lumbee vs Iranian Unemployment Among Ages 30 to 34 years
COMPARE
Lumbee
Iranian
Unemployment Among Ages 30 to 34 years
Unemployment Among Ages 30 to 34 years Comparison
Lumbee
Iranians
7.1%
UNEMPLOYMENT AMONG AGES 30 TO 34 YEARS
0.0/ 100
METRIC RATING
314th/ 347
METRIC RANK
5.2%
UNEMPLOYMENT AMONG AGES 30 TO 34 YEARS
96.0/ 100
METRIC RATING
75th/ 347
METRIC RANK
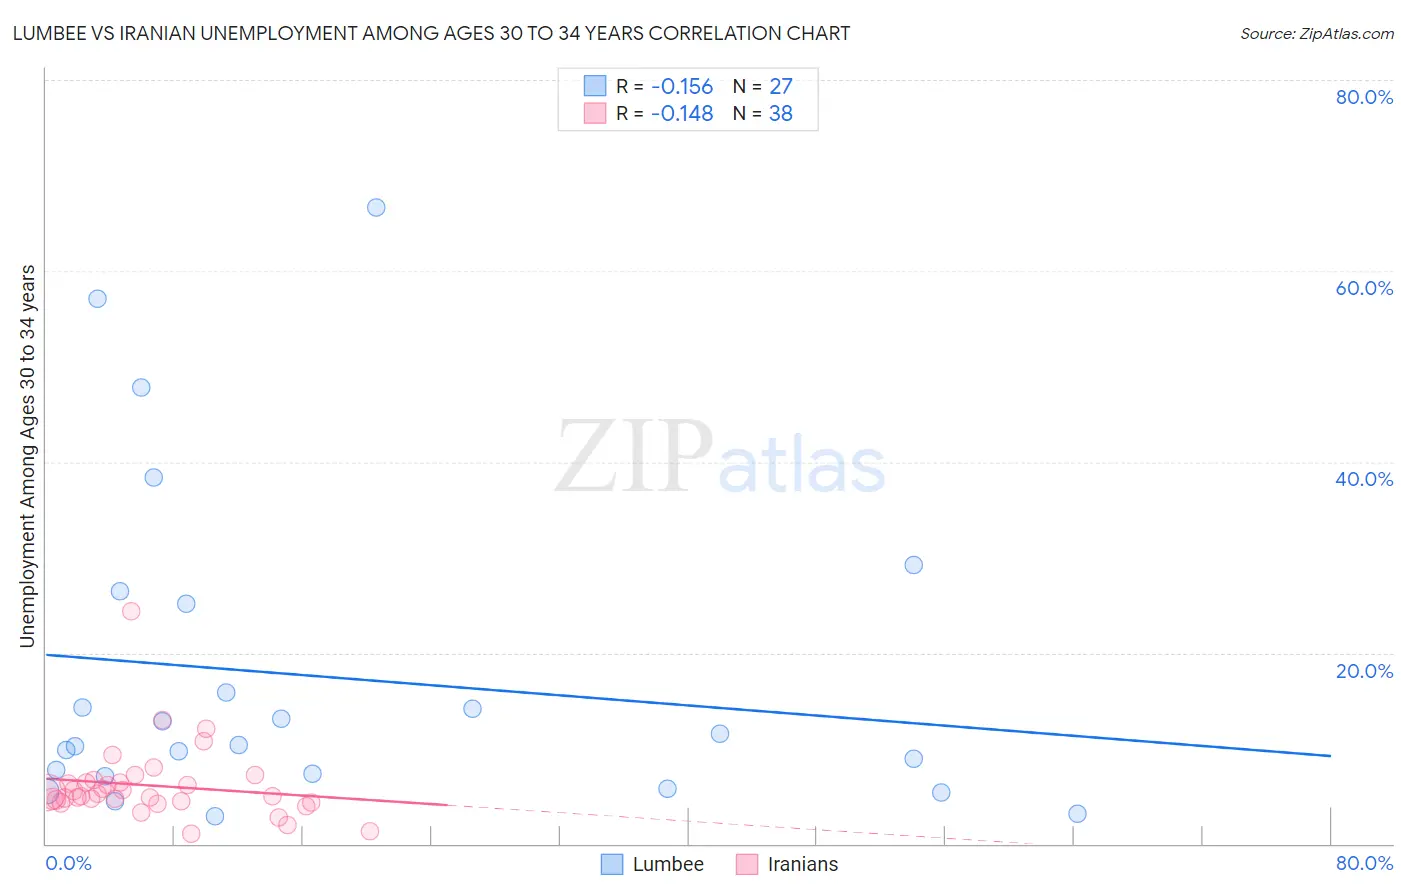
Lumbee vs Iranian Unemployment Among Ages 30 to 34 years Correlation Chart
The statistical analysis conducted on geographies consisting of 89,655,506 people shows a poor negative correlation between the proportion of Lumbee and unemployment rate among population between the ages 30 and 34 in the United States with a correlation coefficient (R) of -0.156 and weighted average of 7.1%. Similarly, the statistical analysis conducted on geographies consisting of 304,439,864 people shows a poor negative correlation between the proportion of Iranians and unemployment rate among population between the ages 30 and 34 in the United States with a correlation coefficient (R) of -0.148 and weighted average of 5.2%, a difference of 36.8%.
Unemployment Among Ages 30 to 34 years Correlation Summary
| Measurement | Lumbee | Iranian |
| Minimum | 2.9% | 1.1% |
| Maximum | 66.7% | 24.4% |
| Range | 63.8% | 23.3% |
| Mean | 17.4% | 6.1% |
| Median | 10.3% | 5.1% |
| Interquartile 25% (IQ1) | 7.1% | 4.5% |
| Interquartile 75% (IQ3) | 25.1% | 6.4% |
| Interquartile Range (IQR) | 18.0% | 1.9% |
| Standard Deviation (Sample) | 16.8% | 3.9% |
| Standard Deviation (Population) | 16.5% | 3.9% |
Similar Demographics by Unemployment Among Ages 30 to 34 years
Demographics Similar to Lumbee by Unemployment Among Ages 30 to 34 years
In terms of unemployment among ages 30 to 34 years, the demographic groups most similar to Lumbee are Ute (7.0%, a difference of 0.21%), British West Indian (7.0%, a difference of 0.25%), Alaskan Athabascan (7.0%, a difference of 0.33%), Aleut (7.1%, a difference of 0.37%), and Houma (7.2%, a difference of 1.4%).
| Demographics | Rating | Rank | Unemployment Among Ages 30 to 34 years |
| Immigrants | Belize | 0.0 /100 | #307 | Tragic 6.9% |
| Immigrants | Azores | 0.0 /100 | #308 | Tragic 6.9% |
| Immigrants | Grenada | 0.0 /100 | #309 | Tragic 6.9% |
| Immigrants | St. Vincent and the Grenadines | 0.0 /100 | #310 | Tragic 7.0% |
| Alaskan Athabascans | 0.0 /100 | #311 | Tragic 7.0% |
| British West Indians | 0.0 /100 | #312 | Tragic 7.0% |
| Ute | 0.0 /100 | #313 | Tragic 7.0% |
| Lumbee | 0.0 /100 | #314 | Tragic 7.1% |
| Aleuts | 0.0 /100 | #315 | Tragic 7.1% |
| Houma | 0.0 /100 | #316 | Tragic 7.2% |
| Immigrants | Cabo Verde | 0.0 /100 | #317 | Tragic 7.2% |
| Blacks/African Americans | 0.0 /100 | #318 | Tragic 7.2% |
| Guyanese | 0.0 /100 | #319 | Tragic 7.2% |
| Cape Verdeans | 0.0 /100 | #320 | Tragic 7.2% |
| Immigrants | Guyana | 0.0 /100 | #321 | Tragic 7.2% |
Demographics Similar to Iranians by Unemployment Among Ages 30 to 34 years
In terms of unemployment among ages 30 to 34 years, the demographic groups most similar to Iranians are Immigrants from Asia (5.2%, a difference of 0.060%), Slovene (5.2%, a difference of 0.090%), Immigrants from Moldova (5.1%, a difference of 0.18%), Immigrants from Northern Africa (5.1%, a difference of 0.20%), and Immigrants from Iraq (5.1%, a difference of 0.20%).
| Demographics | Rating | Rank | Unemployment Among Ages 30 to 34 years |
| Jordanians | 96.5 /100 | #68 | Exceptional 5.1% |
| Immigrants | Northern Africa | 96.4 /100 | #69 | Exceptional 5.1% |
| Immigrants | Iraq | 96.4 /100 | #70 | Exceptional 5.1% |
| Paraguayans | 96.4 /100 | #71 | Exceptional 5.1% |
| Immigrants | Moldova | 96.4 /100 | #72 | Exceptional 5.1% |
| Slovenes | 96.2 /100 | #73 | Exceptional 5.2% |
| Immigrants | Asia | 96.2 /100 | #74 | Exceptional 5.2% |
| Iranians | 96.0 /100 | #75 | Exceptional 5.2% |
| Scandinavians | 95.6 /100 | #76 | Exceptional 5.2% |
| Uruguayans | 95.4 /100 | #77 | Exceptional 5.2% |
| Indonesians | 95.1 /100 | #78 | Exceptional 5.2% |
| Immigrants | Lithuania | 95.0 /100 | #79 | Exceptional 5.2% |
| Immigrants | Indonesia | 94.7 /100 | #80 | Exceptional 5.2% |
| Chileans | 94.4 /100 | #81 | Exceptional 5.2% |
| Immigrants | Latvia | 94.2 /100 | #82 | Exceptional 5.2% |