Lumbee vs Bhutanese Unemployment Among Ages 30 to 34 years
COMPARE
Lumbee
Bhutanese
Unemployment Among Ages 30 to 34 years
Unemployment Among Ages 30 to 34 years Comparison
Lumbee
Bhutanese
7.1%
UNEMPLOYMENT AMONG AGES 30 TO 34 YEARS
0.0/ 100
METRIC RATING
314th/ 347
METRIC RANK
5.2%
UNEMPLOYMENT AMONG AGES 30 TO 34 YEARS
93.5/ 100
METRIC RATING
87th/ 347
METRIC RANK
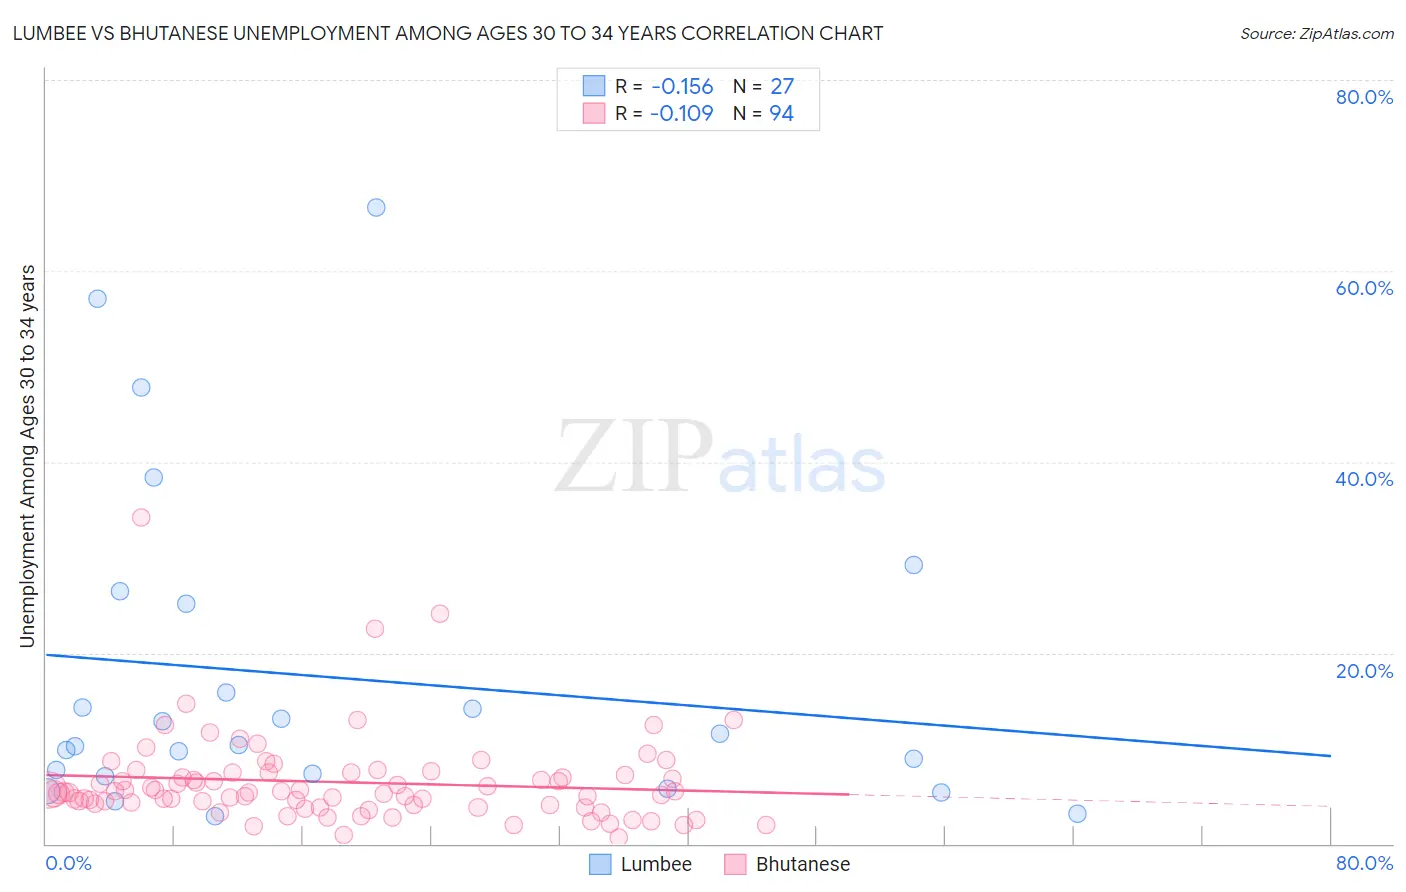
Lumbee vs Bhutanese Unemployment Among Ages 30 to 34 years Correlation Chart
The statistical analysis conducted on geographies consisting of 89,655,506 people shows a poor negative correlation between the proportion of Lumbee and unemployment rate among population between the ages 30 and 34 in the United States with a correlation coefficient (R) of -0.156 and weighted average of 7.1%. Similarly, the statistical analysis conducted on geographies consisting of 423,591,484 people shows a poor negative correlation between the proportion of Bhutanese and unemployment rate among population between the ages 30 and 34 in the United States with a correlation coefficient (R) of -0.109 and weighted average of 5.2%, a difference of 35.5%.
Unemployment Among Ages 30 to 34 years Correlation Summary
| Measurement | Lumbee | Bhutanese |
| Minimum | 2.9% | 0.60% |
| Maximum | 66.7% | 34.2% |
| Range | 63.8% | 33.6% |
| Mean | 17.4% | 6.5% |
| Median | 10.3% | 5.4% |
| Interquartile 25% (IQ1) | 7.1% | 4.1% |
| Interquartile 75% (IQ3) | 25.1% | 7.4% |
| Interquartile Range (IQR) | 18.0% | 3.3% |
| Standard Deviation (Sample) | 16.8% | 4.8% |
| Standard Deviation (Population) | 16.5% | 4.7% |
Similar Demographics by Unemployment Among Ages 30 to 34 years
Demographics Similar to Lumbee by Unemployment Among Ages 30 to 34 years
In terms of unemployment among ages 30 to 34 years, the demographic groups most similar to Lumbee are Ute (7.0%, a difference of 0.21%), British West Indian (7.0%, a difference of 0.25%), Alaskan Athabascan (7.0%, a difference of 0.33%), Aleut (7.1%, a difference of 0.37%), and Houma (7.2%, a difference of 1.4%).
| Demographics | Rating | Rank | Unemployment Among Ages 30 to 34 years |
| Immigrants | Belize | 0.0 /100 | #307 | Tragic 6.9% |
| Immigrants | Azores | 0.0 /100 | #308 | Tragic 6.9% |
| Immigrants | Grenada | 0.0 /100 | #309 | Tragic 6.9% |
| Immigrants | St. Vincent and the Grenadines | 0.0 /100 | #310 | Tragic 7.0% |
| Alaskan Athabascans | 0.0 /100 | #311 | Tragic 7.0% |
| British West Indians | 0.0 /100 | #312 | Tragic 7.0% |
| Ute | 0.0 /100 | #313 | Tragic 7.0% |
| Lumbee | 0.0 /100 | #314 | Tragic 7.1% |
| Aleuts | 0.0 /100 | #315 | Tragic 7.1% |
| Houma | 0.0 /100 | #316 | Tragic 7.2% |
| Immigrants | Cabo Verde | 0.0 /100 | #317 | Tragic 7.2% |
| Blacks/African Americans | 0.0 /100 | #318 | Tragic 7.2% |
| Guyanese | 0.0 /100 | #319 | Tragic 7.2% |
| Cape Verdeans | 0.0 /100 | #320 | Tragic 7.2% |
| Immigrants | Guyana | 0.0 /100 | #321 | Tragic 7.2% |
Demographics Similar to Bhutanese by Unemployment Among Ages 30 to 34 years
In terms of unemployment among ages 30 to 34 years, the demographic groups most similar to Bhutanese are Immigrants from Australia (5.2%, a difference of 0.010%), Immigrants from Kenya (5.2%, a difference of 0.040%), Immigrants from Sweden (5.2%, a difference of 0.050%), Immigrants from Egypt (5.2%, a difference of 0.12%), and Immigrants from Uganda (5.2%, a difference of 0.15%).
| Demographics | Rating | Rank | Unemployment Among Ages 30 to 34 years |
| Immigrants | Indonesia | 94.7 /100 | #80 | Exceptional 5.2% |
| Chileans | 94.4 /100 | #81 | Exceptional 5.2% |
| Immigrants | Latvia | 94.2 /100 | #82 | Exceptional 5.2% |
| Immigrants | Korea | 94.1 /100 | #83 | Exceptional 5.2% |
| Immigrants | Uganda | 94.0 /100 | #84 | Exceptional 5.2% |
| Immigrants | Egypt | 93.9 /100 | #85 | Exceptional 5.2% |
| Immigrants | Australia | 93.5 /100 | #86 | Exceptional 5.2% |
| Bhutanese | 93.5 /100 | #87 | Exceptional 5.2% |
| Immigrants | Kenya | 93.3 /100 | #88 | Exceptional 5.2% |
| Immigrants | Sweden | 93.3 /100 | #89 | Exceptional 5.2% |
| Immigrants | Romania | 92.8 /100 | #90 | Exceptional 5.2% |
| Iraqis | 92.6 /100 | #91 | Exceptional 5.2% |
| Immigrants | Argentina | 92.5 /100 | #92 | Exceptional 5.2% |
| Laotians | 92.4 /100 | #93 | Exceptional 5.2% |
| Maltese | 92.3 /100 | #94 | Exceptional 5.2% |