Lumbee vs Estonian Unemployment Among Ages 30 to 34 years
COMPARE
Lumbee
Estonian
Unemployment Among Ages 30 to 34 years
Unemployment Among Ages 30 to 34 years Comparison
Lumbee
Estonians
7.1%
UNEMPLOYMENT AMONG AGES 30 TO 34 YEARS
0.0/ 100
METRIC RATING
314th/ 347
METRIC RANK
5.3%
UNEMPLOYMENT AMONG AGES 30 TO 34 YEARS
83.7/ 100
METRIC RATING
114th/ 347
METRIC RANK
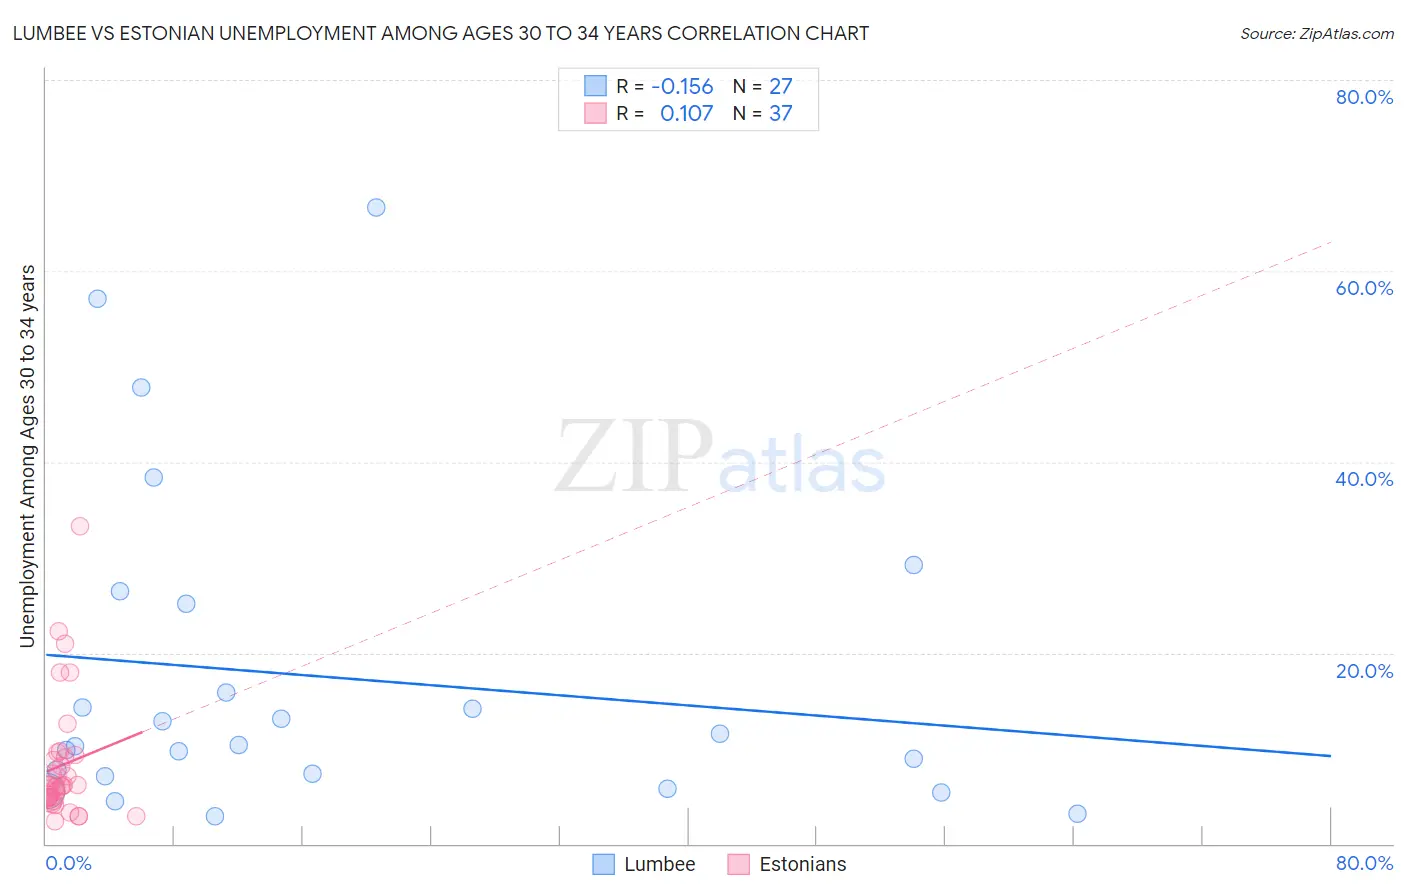
Lumbee vs Estonian Unemployment Among Ages 30 to 34 years Correlation Chart
The statistical analysis conducted on geographies consisting of 89,655,506 people shows a poor negative correlation between the proportion of Lumbee and unemployment rate among population between the ages 30 and 34 in the United States with a correlation coefficient (R) of -0.156 and weighted average of 7.1%. Similarly, the statistical analysis conducted on geographies consisting of 120,374,658 people shows a poor positive correlation between the proportion of Estonians and unemployment rate among population between the ages 30 and 34 in the United States with a correlation coefficient (R) of 0.107 and weighted average of 5.3%, a difference of 33.0%.
Unemployment Among Ages 30 to 34 years Correlation Summary
| Measurement | Lumbee | Estonian |
| Minimum | 2.9% | 2.3% |
| Maximum | 66.7% | 33.3% |
| Range | 63.8% | 31.0% |
| Mean | 17.4% | 8.2% |
| Median | 10.3% | 6.1% |
| Interquartile 25% (IQ1) | 7.1% | 4.8% |
| Interquartile 75% (IQ3) | 25.1% | 9.1% |
| Interquartile Range (IQR) | 18.0% | 4.3% |
| Standard Deviation (Sample) | 16.8% | 6.5% |
| Standard Deviation (Population) | 16.5% | 6.4% |
Similar Demographics by Unemployment Among Ages 30 to 34 years
Demographics Similar to Lumbee by Unemployment Among Ages 30 to 34 years
In terms of unemployment among ages 30 to 34 years, the demographic groups most similar to Lumbee are Ute (7.0%, a difference of 0.21%), British West Indian (7.0%, a difference of 0.25%), Alaskan Athabascan (7.0%, a difference of 0.33%), Aleut (7.1%, a difference of 0.37%), and Houma (7.2%, a difference of 1.4%).
| Demographics | Rating | Rank | Unemployment Among Ages 30 to 34 years |
| Immigrants | Belize | 0.0 /100 | #307 | Tragic 6.9% |
| Immigrants | Azores | 0.0 /100 | #308 | Tragic 6.9% |
| Immigrants | Grenada | 0.0 /100 | #309 | Tragic 6.9% |
| Immigrants | St. Vincent and the Grenadines | 0.0 /100 | #310 | Tragic 7.0% |
| Alaskan Athabascans | 0.0 /100 | #311 | Tragic 7.0% |
| British West Indians | 0.0 /100 | #312 | Tragic 7.0% |
| Ute | 0.0 /100 | #313 | Tragic 7.0% |
| Lumbee | 0.0 /100 | #314 | Tragic 7.1% |
| Aleuts | 0.0 /100 | #315 | Tragic 7.1% |
| Houma | 0.0 /100 | #316 | Tragic 7.2% |
| Immigrants | Cabo Verde | 0.0 /100 | #317 | Tragic 7.2% |
| Blacks/African Americans | 0.0 /100 | #318 | Tragic 7.2% |
| Guyanese | 0.0 /100 | #319 | Tragic 7.2% |
| Cape Verdeans | 0.0 /100 | #320 | Tragic 7.2% |
| Immigrants | Guyana | 0.0 /100 | #321 | Tragic 7.2% |
Demographics Similar to Estonians by Unemployment Among Ages 30 to 34 years
In terms of unemployment among ages 30 to 34 years, the demographic groups most similar to Estonians are Immigrants from Albania (5.3%, a difference of 0.040%), Eastern European (5.3%, a difference of 0.070%), Australian (5.3%, a difference of 0.080%), Immigrants from South Africa (5.3%, a difference of 0.090%), and New Zealander (5.3%, a difference of 0.15%).
| Demographics | Rating | Rank | Unemployment Among Ages 30 to 34 years |
| Icelanders | 87.2 /100 | #107 | Excellent 5.3% |
| Immigrants | Middle Africa | 87.1 /100 | #108 | Excellent 5.3% |
| Immigrants | Chile | 86.7 /100 | #109 | Excellent 5.3% |
| Egyptians | 86.4 /100 | #110 | Excellent 5.3% |
| Immigrants | Pakistan | 86.2 /100 | #111 | Excellent 5.3% |
| Swiss | 85.9 /100 | #112 | Excellent 5.3% |
| Immigrants | Spain | 85.6 /100 | #113 | Excellent 5.3% |
| Estonians | 83.7 /100 | #114 | Excellent 5.3% |
| Immigrants | Albania | 83.4 /100 | #115 | Excellent 5.3% |
| Eastern Europeans | 83.2 /100 | #116 | Excellent 5.3% |
| Australians | 83.1 /100 | #117 | Excellent 5.3% |
| Immigrants | South Africa | 83.0 /100 | #118 | Excellent 5.3% |
| New Zealanders | 82.5 /100 | #119 | Excellent 5.3% |
| Immigrants | Poland | 82.4 /100 | #120 | Excellent 5.3% |
| Romanians | 82.3 /100 | #121 | Excellent 5.3% |