Lumbee vs Bhutanese Unemployment Among Ages 16 to 19 years
COMPARE
Lumbee
Bhutanese
Unemployment Among Ages 16 to 19 years
Unemployment Among Ages 16 to 19 years Comparison
Lumbee
Bhutanese
19.1%
UNEMPLOYMENT AMONG AGES 16 TO 19 YEARS
0.1/ 100
METRIC RATING
269th/ 347
METRIC RANK
16.4%
UNEMPLOYMENT AMONG AGES 16 TO 19 YEARS
99.6/ 100
METRIC RATING
50th/ 347
METRIC RANK
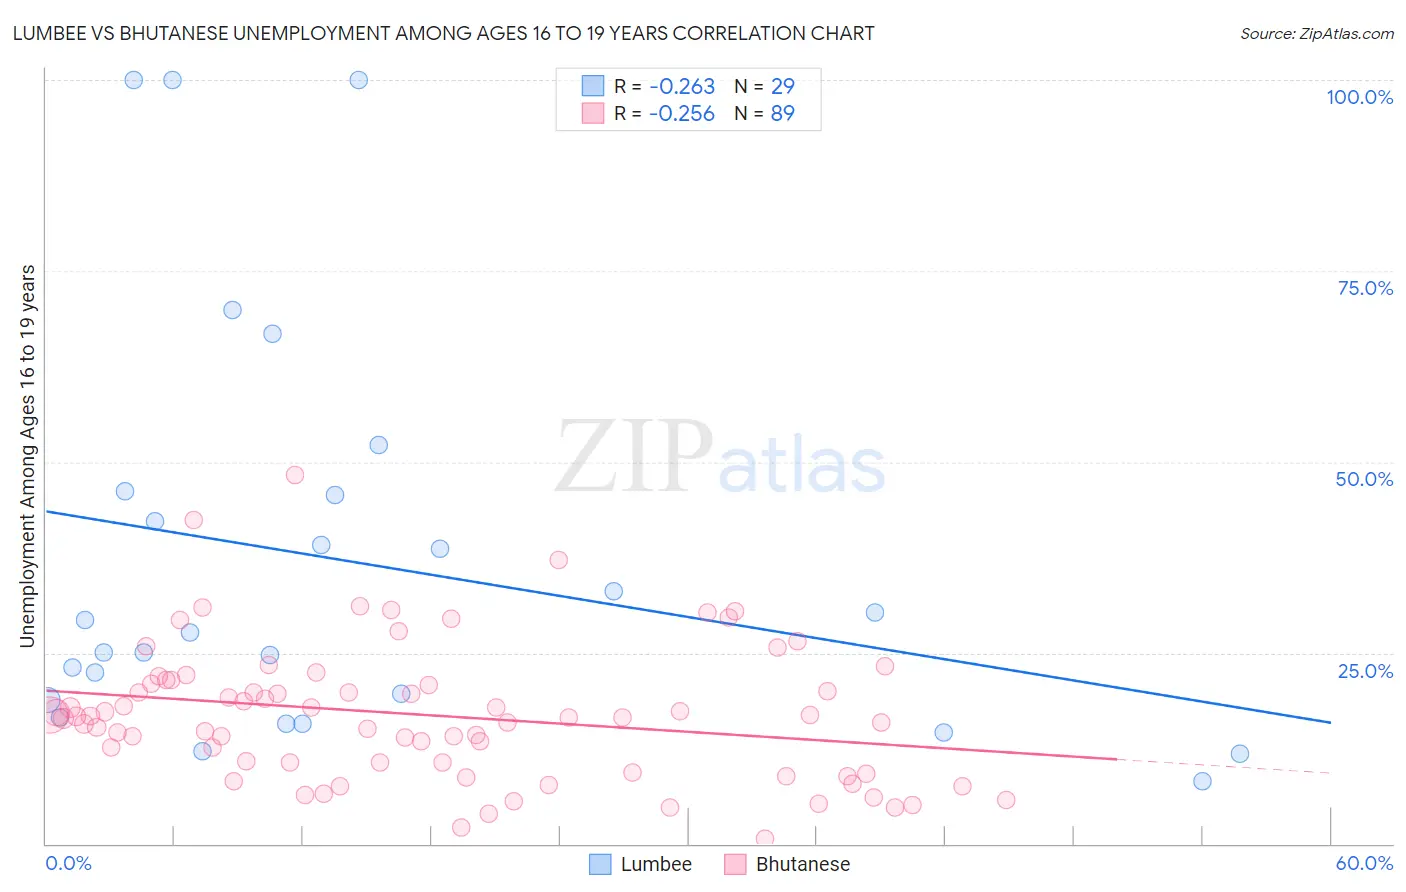
Lumbee vs Bhutanese Unemployment Among Ages 16 to 19 years Correlation Chart
The statistical analysis conducted on geographies consisting of 90,019,475 people shows a weak negative correlation between the proportion of Lumbee and unemployment rate among population between the ages 16 and 19 in the United States with a correlation coefficient (R) of -0.263 and weighted average of 19.1%. Similarly, the statistical analysis conducted on geographies consisting of 428,163,973 people shows a weak negative correlation between the proportion of Bhutanese and unemployment rate among population between the ages 16 and 19 in the United States with a correlation coefficient (R) of -0.256 and weighted average of 16.4%, a difference of 16.5%.
Unemployment Among Ages 16 to 19 years Correlation Summary
| Measurement | Lumbee | Bhutanese |
| Minimum | 8.2% | 0.70% |
| Maximum | 100.0% | 48.3% |
| Range | 91.8% | 47.6% |
| Mean | 37.0% | 16.9% |
| Median | 27.6% | 16.5% |
| Interquartile 25% (IQ1) | 17.7% | 10.0% |
| Interquartile 75% (IQ3) | 46.0% | 21.2% |
| Interquartile Range (IQR) | 28.3% | 11.2% |
| Standard Deviation (Sample) | 26.7% | 8.9% |
| Standard Deviation (Population) | 26.2% | 8.8% |
Similar Demographics by Unemployment Among Ages 16 to 19 years
Demographics Similar to Lumbee by Unemployment Among Ages 16 to 19 years
In terms of unemployment among ages 16 to 19 years, the demographic groups most similar to Lumbee are Immigrants from El Salvador (19.1%, a difference of 0.080%), Honduran (19.2%, a difference of 0.18%), Israeli (19.0%, a difference of 0.36%), Blackfeet (19.2%, a difference of 0.55%), and Hispanic or Latino (19.2%, a difference of 0.68%).
| Demographics | Rating | Rank | Unemployment Among Ages 16 to 19 years |
| Salvadorans | 0.1 /100 | #262 | Tragic 18.9% |
| Cree | 0.1 /100 | #263 | Tragic 19.0% |
| Yaqui | 0.1 /100 | #264 | Tragic 19.0% |
| Choctaw | 0.1 /100 | #265 | Tragic 19.0% |
| Immigrants | Honduras | 0.1 /100 | #266 | Tragic 19.0% |
| Israelis | 0.1 /100 | #267 | Tragic 19.0% |
| Immigrants | El Salvador | 0.1 /100 | #268 | Tragic 19.1% |
| Lumbee | 0.1 /100 | #269 | Tragic 19.1% |
| Hondurans | 0.1 /100 | #270 | Tragic 19.2% |
| Blackfeet | 0.0 /100 | #271 | Tragic 19.2% |
| Hispanics or Latinos | 0.0 /100 | #272 | Tragic 19.2% |
| Immigrants | Panama | 0.0 /100 | #273 | Tragic 19.3% |
| Shoshone | 0.0 /100 | #274 | Tragic 19.3% |
| Paraguayans | 0.0 /100 | #275 | Tragic 19.4% |
| Immigrants | Latin America | 0.0 /100 | #276 | Tragic 19.4% |
Demographics Similar to Bhutanese by Unemployment Among Ages 16 to 19 years
In terms of unemployment among ages 16 to 19 years, the demographic groups most similar to Bhutanese are Lebanese (16.4%, a difference of 0.10%), Iraqi (16.4%, a difference of 0.14%), Welsh (16.4%, a difference of 0.14%), Maltese (16.4%, a difference of 0.21%), and Slovene (16.4%, a difference of 0.22%).
| Demographics | Rating | Rank | Unemployment Among Ages 16 to 19 years |
| Immigrants | Lebanon | 99.8 /100 | #43 | Exceptional 16.3% |
| Immigrants | Zimbabwe | 99.7 /100 | #44 | Exceptional 16.3% |
| Poles | 99.7 /100 | #45 | Exceptional 16.4% |
| Immigrants | North Macedonia | 99.7 /100 | #46 | Exceptional 16.4% |
| Immigrants | Vietnam | 99.7 /100 | #47 | Exceptional 16.4% |
| Maltese | 99.7 /100 | #48 | Exceptional 16.4% |
| Iraqis | 99.7 /100 | #49 | Exceptional 16.4% |
| Bhutanese | 99.6 /100 | #50 | Exceptional 16.4% |
| Lebanese | 99.6 /100 | #51 | Exceptional 16.4% |
| Welsh | 99.6 /100 | #52 | Exceptional 16.4% |
| Slovenes | 99.6 /100 | #53 | Exceptional 16.4% |
| British | 99.5 /100 | #54 | Exceptional 16.5% |
| Czechoslovakians | 99.5 /100 | #55 | Exceptional 16.5% |
| Sri Lankans | 99.5 /100 | #56 | Exceptional 16.5% |
| Immigrants | Jordan | 99.4 /100 | #57 | Exceptional 16.5% |