Lithuanian vs Macedonian Female Unemployment
COMPARE
Lithuanian
Macedonian
Female Unemployment
Female Unemployment Comparison
Lithuanians
Macedonians
4.7%
FEMALE UNEMPLOYMENT
99.8/ 100
METRIC RATING
30th/ 347
METRIC RANK
5.1%
FEMALE UNEMPLOYMENT
92.4/ 100
METRIC RATING
110th/ 347
METRIC RANK
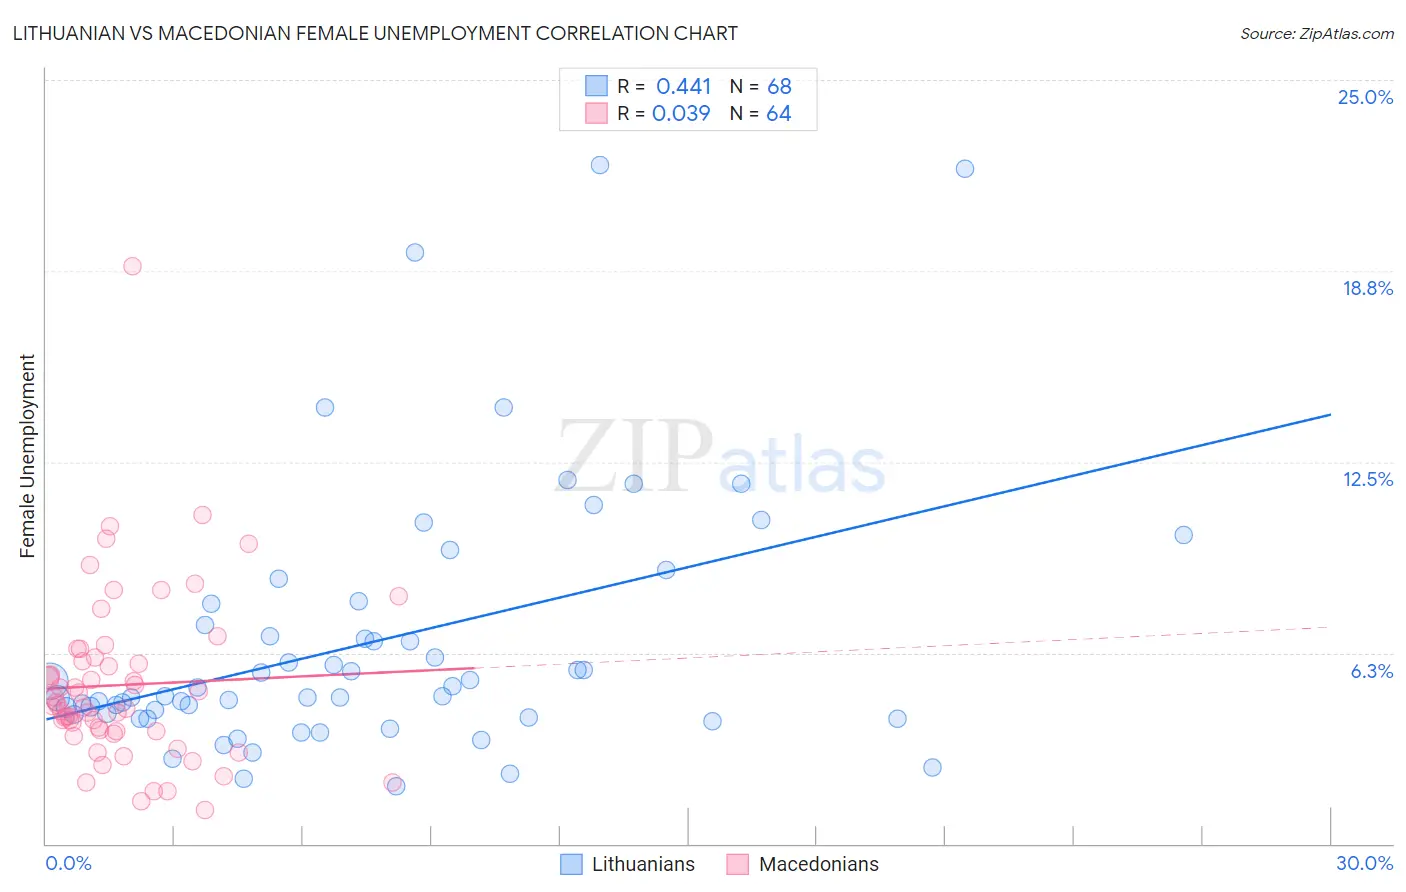
Lithuanian vs Macedonian Female Unemployment Correlation Chart
The statistical analysis conducted on geographies consisting of 418,507,146 people shows a moderate positive correlation between the proportion of Lithuanians and unemploymnet rate among females in the United States with a correlation coefficient (R) of 0.441 and weighted average of 4.7%. Similarly, the statistical analysis conducted on geographies consisting of 132,466,796 people shows no correlation between the proportion of Macedonians and unemploymnet rate among females in the United States with a correlation coefficient (R) of 0.039 and weighted average of 5.1%, a difference of 6.7%.
Female Unemployment Correlation Summary
| Measurement | Lithuanian | Macedonian |
| Minimum | 1.9% | 1.1% |
| Maximum | 22.2% | 18.9% |
| Range | 20.3% | 17.8% |
| Mean | 6.6% | 5.2% |
| Median | 4.8% | 4.5% |
| Interquartile 25% (IQ1) | 4.2% | 3.7% |
| Interquartile 75% (IQ3) | 7.5% | 6.0% |
| Interquartile Range (IQR) | 3.3% | 2.3% |
| Standard Deviation (Sample) | 4.3% | 2.8% |
| Standard Deviation (Population) | 4.2% | 2.8% |
Similar Demographics by Female Unemployment
Demographics Similar to Lithuanians by Female Unemployment
In terms of female unemployment, the demographic groups most similar to Lithuanians are Cypriot (4.7%, a difference of 0.12%), Irish (4.7%, a difference of 0.13%), British (4.7%, a difference of 0.16%), Sudanese (4.8%, a difference of 0.28%), and Immigrants from Bosnia and Herzegovina (4.7%, a difference of 0.33%).
| Demographics | Rating | Rank | Female Unemployment |
| Scottish | 99.9 /100 | #23 | Exceptional 4.7% |
| Welsh | 99.9 /100 | #24 | Exceptional 4.7% |
| Immigrants | India | 99.9 /100 | #25 | Exceptional 4.7% |
| Immigrants | Bosnia and Herzegovina | 99.9 /100 | #26 | Exceptional 4.7% |
| British | 99.9 /100 | #27 | Exceptional 4.7% |
| Irish | 99.9 /100 | #28 | Exceptional 4.7% |
| Cypriots | 99.9 /100 | #29 | Exceptional 4.7% |
| Lithuanians | 99.8 /100 | #30 | Exceptional 4.7% |
| Sudanese | 99.8 /100 | #31 | Exceptional 4.8% |
| Slovaks | 99.8 /100 | #32 | Exceptional 4.8% |
| Czechoslovakians | 99.7 /100 | #33 | Exceptional 4.8% |
| Zimbabweans | 99.7 /100 | #34 | Exceptional 4.8% |
| French Canadians | 99.7 /100 | #35 | Exceptional 4.8% |
| Yugoslavians | 99.7 /100 | #36 | Exceptional 4.8% |
| Pennsylvania Germans | 99.6 /100 | #37 | Exceptional 4.8% |
Demographics Similar to Macedonians by Female Unemployment
In terms of female unemployment, the demographic groups most similar to Macedonians are Immigrants from Burma/Myanmar (5.1%, a difference of 0.030%), Estonian (5.1%, a difference of 0.060%), Immigrants from Eastern Africa (5.1%, a difference of 0.10%), Puget Sound Salish (5.1%, a difference of 0.14%), and Immigrants from Switzerland (5.1%, a difference of 0.17%).
| Demographics | Rating | Rank | Female Unemployment |
| Somalis | 94.6 /100 | #103 | Exceptional 5.0% |
| Kenyans | 93.7 /100 | #104 | Exceptional 5.0% |
| Immigrants | England | 93.6 /100 | #105 | Exceptional 5.0% |
| Paraguayans | 93.2 /100 | #106 | Exceptional 5.1% |
| Immigrants | Switzerland | 93.1 /100 | #107 | Exceptional 5.1% |
| Puget Sound Salish | 93.0 /100 | #108 | Exceptional 5.1% |
| Immigrants | Eastern Africa | 92.8 /100 | #109 | Exceptional 5.1% |
| Macedonians | 92.4 /100 | #110 | Exceptional 5.1% |
| Immigrants | Burma/Myanmar | 92.3 /100 | #111 | Exceptional 5.1% |
| Estonians | 92.1 /100 | #112 | Exceptional 5.1% |
| Immigrants | Saudi Arabia | 91.2 /100 | #113 | Exceptional 5.1% |
| Immigrants | Turkey | 91.0 /100 | #114 | Exceptional 5.1% |
| Lebanese | 91.0 /100 | #115 | Exceptional 5.1% |
| Americans | 90.5 /100 | #116 | Exceptional 5.1% |
| Jordanians | 90.3 /100 | #117 | Exceptional 5.1% |