Lithuanian vs Comanche Female Unemployment
COMPARE
Lithuanian
Comanche
Female Unemployment
Female Unemployment Comparison
Lithuanians
Comanche
4.7%
FEMALE UNEMPLOYMENT
99.8/ 100
METRIC RATING
30th/ 347
METRIC RANK
5.4%
FEMALE UNEMPLOYMENT
10.0/ 100
METRIC RATING
216th/ 347
METRIC RANK
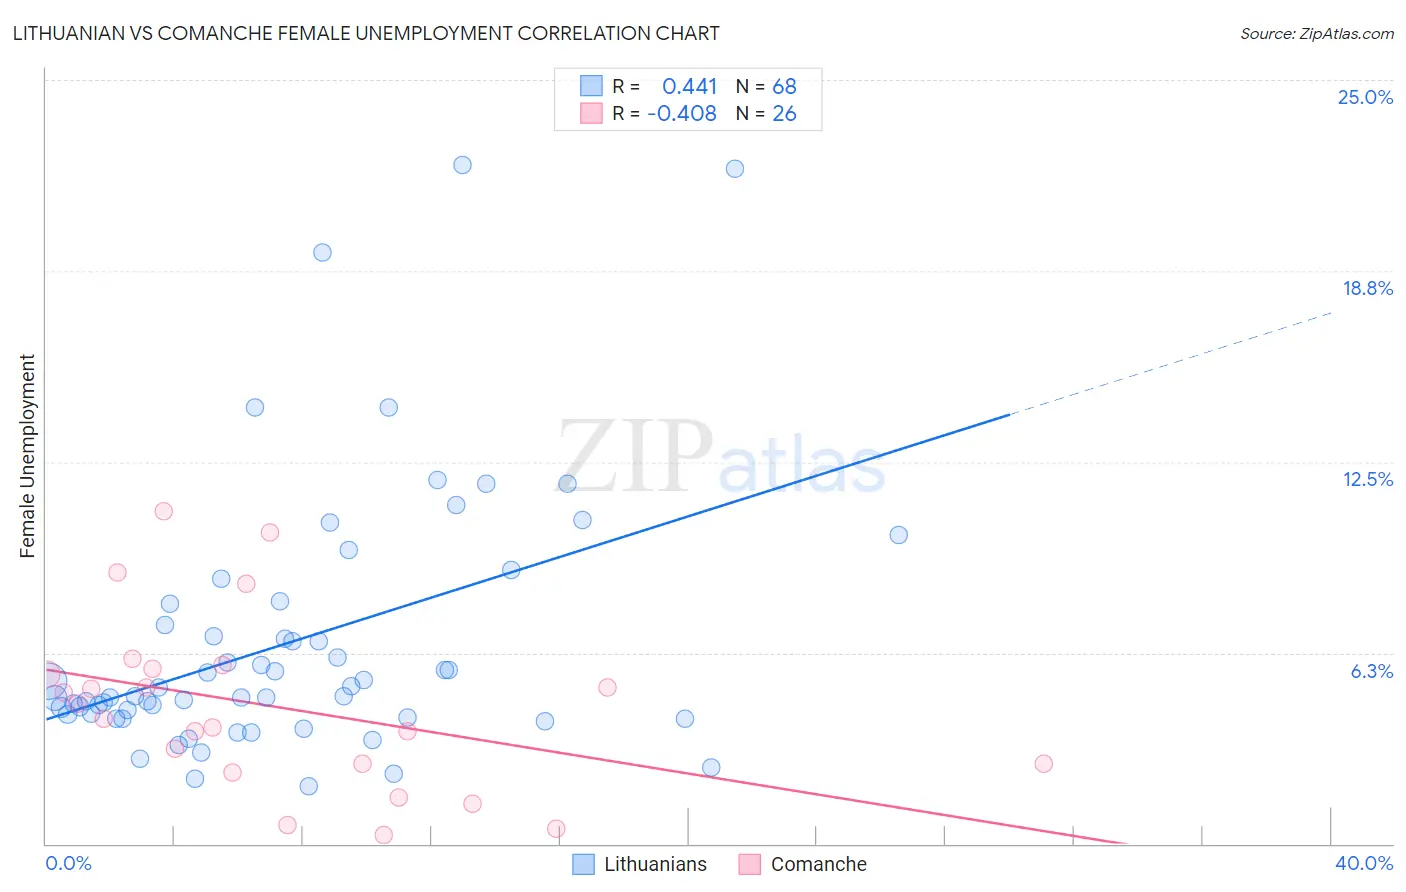
Lithuanian vs Comanche Female Unemployment Correlation Chart
The statistical analysis conducted on geographies consisting of 418,507,146 people shows a moderate positive correlation between the proportion of Lithuanians and unemploymnet rate among females in the United States with a correlation coefficient (R) of 0.441 and weighted average of 4.7%. Similarly, the statistical analysis conducted on geographies consisting of 109,454,085 people shows a moderate negative correlation between the proportion of Comanche and unemploymnet rate among females in the United States with a correlation coefficient (R) of -0.408 and weighted average of 5.4%, a difference of 14.5%.
Female Unemployment Correlation Summary
| Measurement | Lithuanian | Comanche |
| Minimum | 1.9% | 0.30% |
| Maximum | 22.2% | 10.9% |
| Range | 20.3% | 10.6% |
| Mean | 6.6% | 4.5% |
| Median | 4.8% | 4.3% |
| Interquartile 25% (IQ1) | 4.2% | 2.6% |
| Interquartile 75% (IQ3) | 7.5% | 5.7% |
| Interquartile Range (IQR) | 3.3% | 3.1% |
| Standard Deviation (Sample) | 4.3% | 2.8% |
| Standard Deviation (Population) | 4.2% | 2.8% |
Similar Demographics by Female Unemployment
Demographics Similar to Lithuanians by Female Unemployment
In terms of female unemployment, the demographic groups most similar to Lithuanians are Cypriot (4.7%, a difference of 0.12%), Irish (4.7%, a difference of 0.13%), British (4.7%, a difference of 0.16%), Sudanese (4.8%, a difference of 0.28%), and Immigrants from Bosnia and Herzegovina (4.7%, a difference of 0.33%).
| Demographics | Rating | Rank | Female Unemployment |
| Scottish | 99.9 /100 | #23 | Exceptional 4.7% |
| Welsh | 99.9 /100 | #24 | Exceptional 4.7% |
| Immigrants | India | 99.9 /100 | #25 | Exceptional 4.7% |
| Immigrants | Bosnia and Herzegovina | 99.9 /100 | #26 | Exceptional 4.7% |
| British | 99.9 /100 | #27 | Exceptional 4.7% |
| Irish | 99.9 /100 | #28 | Exceptional 4.7% |
| Cypriots | 99.9 /100 | #29 | Exceptional 4.7% |
| Lithuanians | 99.8 /100 | #30 | Exceptional 4.7% |
| Sudanese | 99.8 /100 | #31 | Exceptional 4.8% |
| Slovaks | 99.8 /100 | #32 | Exceptional 4.8% |
| Czechoslovakians | 99.7 /100 | #33 | Exceptional 4.8% |
| Zimbabweans | 99.7 /100 | #34 | Exceptional 4.8% |
| French Canadians | 99.7 /100 | #35 | Exceptional 4.8% |
| Yugoslavians | 99.7 /100 | #36 | Exceptional 4.8% |
| Pennsylvania Germans | 99.6 /100 | #37 | Exceptional 4.8% |
Demographics Similar to Comanche by Female Unemployment
In terms of female unemployment, the demographic groups most similar to Comanche are Immigrants from Nicaragua (5.4%, a difference of 0.020%), Seminole (5.4%, a difference of 0.040%), Peruvian (5.4%, a difference of 0.070%), Samoan (5.4%, a difference of 0.090%), and Bermudan (5.4%, a difference of 0.17%).
| Demographics | Rating | Rank | Female Unemployment |
| Koreans | 13.4 /100 | #209 | Poor 5.4% |
| Choctaw | 12.3 /100 | #210 | Poor 5.4% |
| Ottawa | 11.6 /100 | #211 | Poor 5.4% |
| Uruguayans | 11.4 /100 | #212 | Poor 5.4% |
| Samoans | 10.6 /100 | #213 | Poor 5.4% |
| Seminole | 10.3 /100 | #214 | Poor 5.4% |
| Immigrants | Nicaragua | 10.2 /100 | #215 | Poor 5.4% |
| Comanche | 10.0 /100 | #216 | Poor 5.4% |
| Peruvians | 9.6 /100 | #217 | Tragic 5.4% |
| Bermudans | 9.0 /100 | #218 | Tragic 5.4% |
| South Americans | 8.6 /100 | #219 | Tragic 5.4% |
| Immigrants | Africa | 8.5 /100 | #220 | Tragic 5.4% |
| Brazilians | 7.3 /100 | #221 | Tragic 5.5% |
| Nicaraguans | 7.2 /100 | #222 | Tragic 5.5% |
| Delaware | 7.2 /100 | #223 | Tragic 5.5% |