Arab vs Comanche Female Unemployment
COMPARE
Arab
Comanche
Female Unemployment
Female Unemployment Comparison
Arabs
Comanche
5.3%
FEMALE UNEMPLOYMENT
27.7/ 100
METRIC RATING
193rd/ 347
METRIC RANK
5.4%
FEMALE UNEMPLOYMENT
10.0/ 100
METRIC RATING
216th/ 347
METRIC RANK
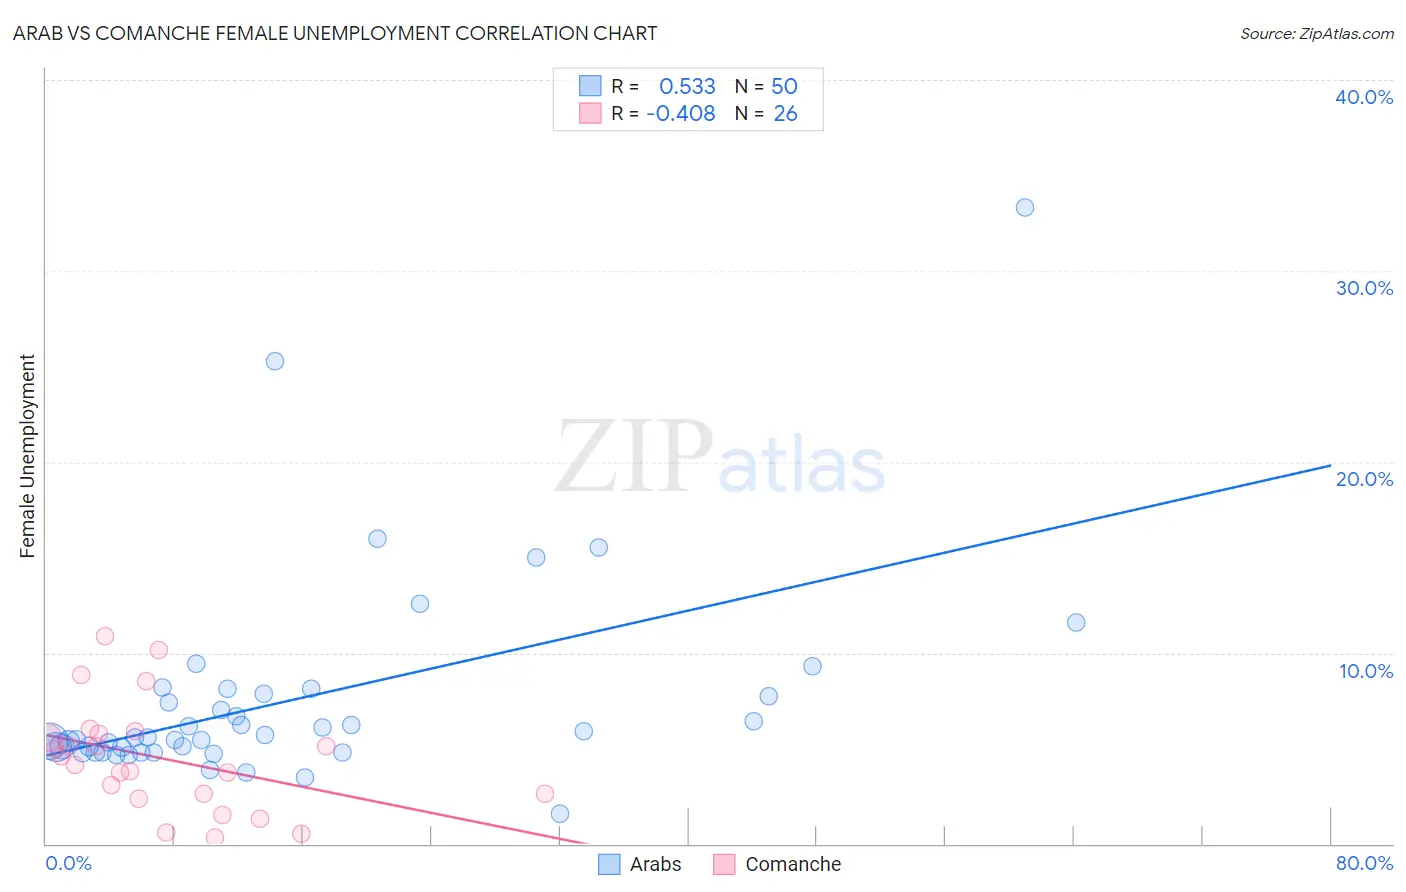
Arab vs Comanche Female Unemployment Correlation Chart
The statistical analysis conducted on geographies consisting of 483,183,943 people shows a substantial positive correlation between the proportion of Arabs and unemploymnet rate among females in the United States with a correlation coefficient (R) of 0.533 and weighted average of 5.3%. Similarly, the statistical analysis conducted on geographies consisting of 109,454,085 people shows a moderate negative correlation between the proportion of Comanche and unemploymnet rate among females in the United States with a correlation coefficient (R) of -0.408 and weighted average of 5.4%, a difference of 1.8%.
Female Unemployment Correlation Summary
| Measurement | Arab | Comanche |
| Minimum | 1.6% | 0.30% |
| Maximum | 33.3% | 10.9% |
| Range | 31.7% | 10.6% |
| Mean | 7.5% | 4.5% |
| Median | 5.6% | 4.3% |
| Interquartile 25% (IQ1) | 4.8% | 2.6% |
| Interquartile 75% (IQ3) | 7.8% | 5.7% |
| Interquartile Range (IQR) | 3.0% | 3.1% |
| Standard Deviation (Sample) | 5.4% | 2.8% |
| Standard Deviation (Population) | 5.4% | 2.8% |
Similar Demographics by Female Unemployment
Demographics Similar to Arabs by Female Unemployment
In terms of female unemployment, the demographic groups most similar to Arabs are Colombian (5.3%, a difference of 0.050%), Portuguese (5.3%, a difference of 0.070%), Immigrants from Colombia (5.3%, a difference of 0.11%), Spaniard (5.3%, a difference of 0.19%), and Cherokee (5.3%, a difference of 0.23%).
| Demographics | Rating | Rank | Female Unemployment |
| Immigrants | Belarus | 39.4 /100 | #186 | Fair 5.3% |
| Immigrants | Albania | 35.4 /100 | #187 | Fair 5.3% |
| Afghans | 33.9 /100 | #188 | Fair 5.3% |
| Costa Ricans | 33.8 /100 | #189 | Fair 5.3% |
| Ugandans | 31.2 /100 | #190 | Fair 5.3% |
| Cherokee | 30.8 /100 | #191 | Fair 5.3% |
| Portuguese | 28.6 /100 | #192 | Fair 5.3% |
| Arabs | 27.7 /100 | #193 | Fair 5.3% |
| Colombians | 27.0 /100 | #194 | Fair 5.3% |
| Immigrants | Colombia | 26.2 /100 | #195 | Fair 5.3% |
| Spaniards | 25.2 /100 | #196 | Fair 5.3% |
| Alsatians | 23.9 /100 | #197 | Fair 5.3% |
| Tsimshian | 23.1 /100 | #198 | Fair 5.4% |
| Hawaiians | 22.2 /100 | #199 | Fair 5.4% |
| Soviet Union | 21.7 /100 | #200 | Fair 5.4% |
Demographics Similar to Comanche by Female Unemployment
In terms of female unemployment, the demographic groups most similar to Comanche are Immigrants from Nicaragua (5.4%, a difference of 0.020%), Seminole (5.4%, a difference of 0.040%), Peruvian (5.4%, a difference of 0.070%), Samoan (5.4%, a difference of 0.090%), and Bermudan (5.4%, a difference of 0.17%).
| Demographics | Rating | Rank | Female Unemployment |
| Koreans | 13.4 /100 | #209 | Poor 5.4% |
| Choctaw | 12.3 /100 | #210 | Poor 5.4% |
| Ottawa | 11.6 /100 | #211 | Poor 5.4% |
| Uruguayans | 11.4 /100 | #212 | Poor 5.4% |
| Samoans | 10.6 /100 | #213 | Poor 5.4% |
| Seminole | 10.3 /100 | #214 | Poor 5.4% |
| Immigrants | Nicaragua | 10.2 /100 | #215 | Poor 5.4% |
| Comanche | 10.0 /100 | #216 | Poor 5.4% |
| Peruvians | 9.6 /100 | #217 | Tragic 5.4% |
| Bermudans | 9.0 /100 | #218 | Tragic 5.4% |
| South Americans | 8.6 /100 | #219 | Tragic 5.4% |
| Immigrants | Africa | 8.5 /100 | #220 | Tragic 5.4% |
| Brazilians | 7.3 /100 | #221 | Tragic 5.5% |
| Nicaraguans | 7.2 /100 | #222 | Tragic 5.5% |
| Delaware | 7.2 /100 | #223 | Tragic 5.5% |