Bermudan vs Comanche Female Unemployment
COMPARE
Bermudan
Comanche
Female Unemployment
Female Unemployment Comparison
Bermudans
Comanche
5.4%
FEMALE UNEMPLOYMENT
9.0/ 100
METRIC RATING
218th/ 347
METRIC RANK
5.4%
FEMALE UNEMPLOYMENT
10.0/ 100
METRIC RATING
216th/ 347
METRIC RANK
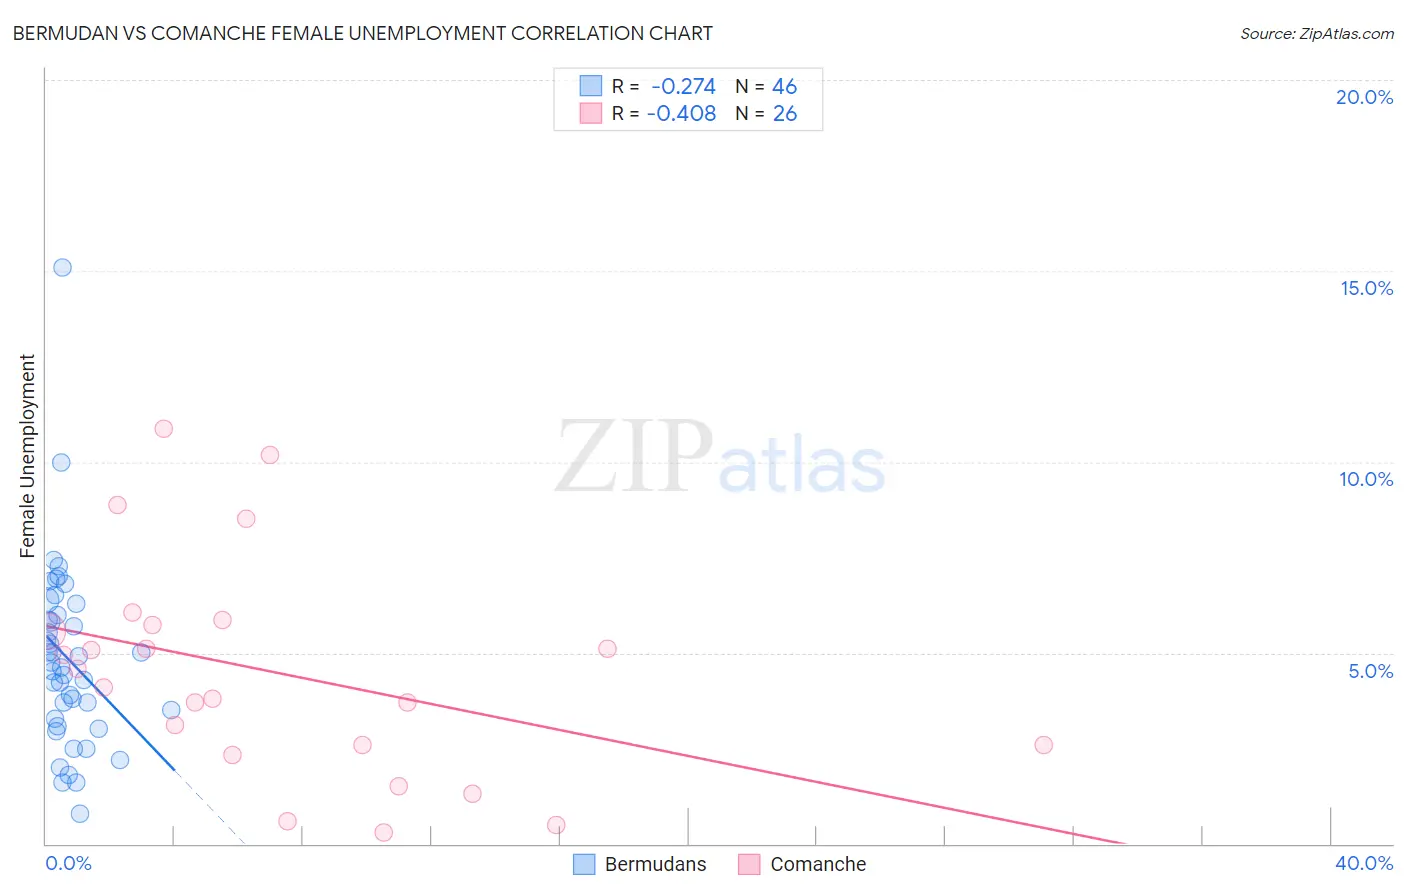
Bermudan vs Comanche Female Unemployment Correlation Chart
The statistical analysis conducted on geographies consisting of 55,695,435 people shows a weak negative correlation between the proportion of Bermudans and unemploymnet rate among females in the United States with a correlation coefficient (R) of -0.274 and weighted average of 5.4%. Similarly, the statistical analysis conducted on geographies consisting of 109,454,085 people shows a moderate negative correlation between the proportion of Comanche and unemploymnet rate among females in the United States with a correlation coefficient (R) of -0.408 and weighted average of 5.4%, a difference of 0.17%.
Female Unemployment Correlation Summary
| Measurement | Bermudan | Comanche |
| Minimum | 0.80% | 0.30% |
| Maximum | 15.1% | 10.9% |
| Range | 14.3% | 10.6% |
| Mean | 4.8% | 4.5% |
| Median | 4.7% | 4.3% |
| Interquartile 25% (IQ1) | 3.3% | 2.6% |
| Interquartile 75% (IQ3) | 6.0% | 5.7% |
| Interquartile Range (IQR) | 2.7% | 3.1% |
| Standard Deviation (Sample) | 2.4% | 2.8% |
| Standard Deviation (Population) | 2.4% | 2.8% |
Demographics Similar to Bermudans and Comanche by Female Unemployment
In terms of female unemployment, the demographic groups most similar to Bermudans are South American (5.4%, a difference of 0.070%), Immigrants from Africa (5.4%, a difference of 0.090%), Peruvian (5.4%, a difference of 0.10%), Immigrants from Nicaragua (5.4%, a difference of 0.19%), and Seminole (5.4%, a difference of 0.21%). Similarly, the demographic groups most similar to Comanche are Immigrants from Nicaragua (5.4%, a difference of 0.020%), Seminole (5.4%, a difference of 0.040%), Peruvian (5.4%, a difference of 0.070%), Samoan (5.4%, a difference of 0.090%), and Uruguayan (5.4%, a difference of 0.21%).
| Demographics | Rating | Rank | Female Unemployment |
| Creek | 15.4 /100 | #207 | Poor 5.4% |
| Immigrants | Costa Rica | 13.7 /100 | #208 | Poor 5.4% |
| Koreans | 13.4 /100 | #209 | Poor 5.4% |
| Choctaw | 12.3 /100 | #210 | Poor 5.4% |
| Ottawa | 11.6 /100 | #211 | Poor 5.4% |
| Uruguayans | 11.4 /100 | #212 | Poor 5.4% |
| Samoans | 10.6 /100 | #213 | Poor 5.4% |
| Seminole | 10.3 /100 | #214 | Poor 5.4% |
| Immigrants | Nicaragua | 10.2 /100 | #215 | Poor 5.4% |
| Comanche | 10.0 /100 | #216 | Poor 5.4% |
| Peruvians | 9.6 /100 | #217 | Tragic 5.4% |
| Bermudans | 9.0 /100 | #218 | Tragic 5.4% |
| South Americans | 8.6 /100 | #219 | Tragic 5.4% |
| Immigrants | Africa | 8.5 /100 | #220 | Tragic 5.4% |
| Brazilians | 7.3 /100 | #221 | Tragic 5.5% |
| Nicaraguans | 7.2 /100 | #222 | Tragic 5.5% |
| Delaware | 7.2 /100 | #223 | Tragic 5.5% |
| Iraqis | 7.1 /100 | #224 | Tragic 5.5% |
| French American Indians | 6.1 /100 | #225 | Tragic 5.5% |
| Immigrants | Peru | 5.9 /100 | #226 | Tragic 5.5% |
| Immigrants | Philippines | 5.3 /100 | #227 | Tragic 5.5% |