Immigrants from Iran vs Comanche Female Unemployment
COMPARE
Immigrants from Iran
Comanche
Female Unemployment
Female Unemployment Comparison
Immigrants from Iran
Comanche
5.5%
FEMALE UNEMPLOYMENT
3.3/ 100
METRIC RATING
235th/ 347
METRIC RANK
5.4%
FEMALE UNEMPLOYMENT
10.0/ 100
METRIC RATING
216th/ 347
METRIC RANK
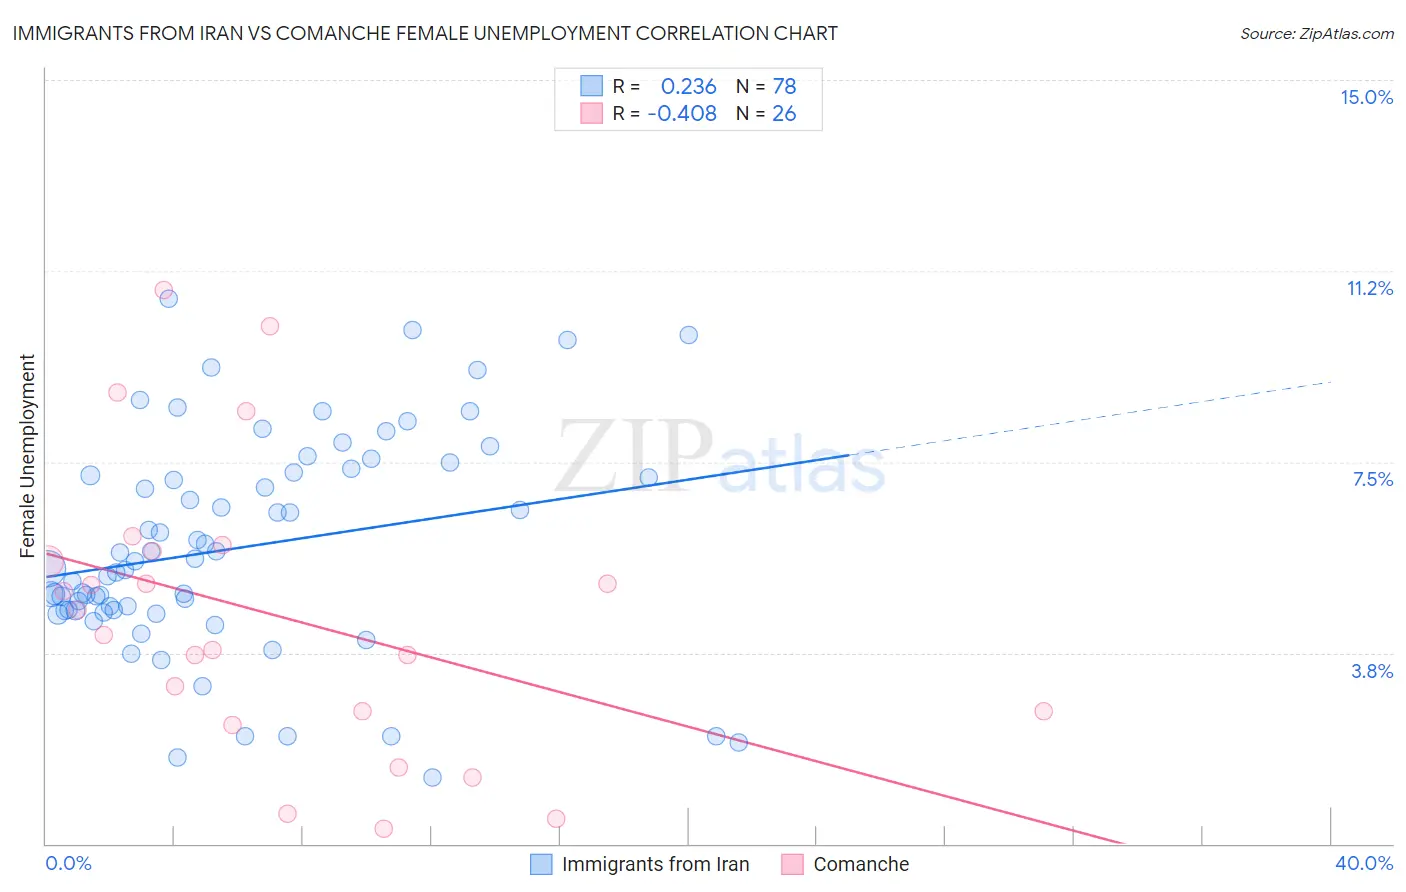
Immigrants from Iran vs Comanche Female Unemployment Correlation Chart
The statistical analysis conducted on geographies consisting of 279,353,147 people shows a weak positive correlation between the proportion of Immigrants from Iran and unemploymnet rate among females in the United States with a correlation coefficient (R) of 0.236 and weighted average of 5.5%. Similarly, the statistical analysis conducted on geographies consisting of 109,454,085 people shows a moderate negative correlation between the proportion of Comanche and unemploymnet rate among females in the United States with a correlation coefficient (R) of -0.408 and weighted average of 5.4%, a difference of 1.7%.
Female Unemployment Correlation Summary
| Measurement | Immigrants from Iran | Comanche |
| Minimum | 1.3% | 0.30% |
| Maximum | 10.7% | 10.9% |
| Range | 9.4% | 10.6% |
| Mean | 5.8% | 4.5% |
| Median | 5.5% | 4.3% |
| Interquartile 25% (IQ1) | 4.6% | 2.6% |
| Interquartile 75% (IQ3) | 7.3% | 5.7% |
| Interquartile Range (IQR) | 2.7% | 3.1% |
| Standard Deviation (Sample) | 2.1% | 2.8% |
| Standard Deviation (Population) | 2.1% | 2.8% |
Demographics Similar to Immigrants from Iran and Comanche by Female Unemployment
In terms of female unemployment, the demographic groups most similar to Immigrants from Iran are Immigrants from Lebanon (5.5%, a difference of 0.0%), Moroccan (5.5%, a difference of 0.030%), Liberian (5.5%, a difference of 0.23%), Immigrants from Iraq (5.5%, a difference of 0.24%), and Immigrants from Uruguay (5.5%, a difference of 0.51%). Similarly, the demographic groups most similar to Comanche are Immigrants from Nicaragua (5.4%, a difference of 0.020%), Peruvian (5.4%, a difference of 0.070%), Bermudan (5.4%, a difference of 0.17%), South American (5.4%, a difference of 0.24%), and Immigrants from Africa (5.4%, a difference of 0.26%).
| Demographics | Rating | Rank | Female Unemployment |
| Immigrants | Nicaragua | 10.2 /100 | #215 | Poor 5.4% |
| Comanche | 10.0 /100 | #216 | Poor 5.4% |
| Peruvians | 9.6 /100 | #217 | Tragic 5.4% |
| Bermudans | 9.0 /100 | #218 | Tragic 5.4% |
| South Americans | 8.6 /100 | #219 | Tragic 5.4% |
| Immigrants | Africa | 8.5 /100 | #220 | Tragic 5.4% |
| Brazilians | 7.3 /100 | #221 | Tragic 5.5% |
| Nicaraguans | 7.2 /100 | #222 | Tragic 5.5% |
| Delaware | 7.2 /100 | #223 | Tragic 5.5% |
| Iraqis | 7.1 /100 | #224 | Tragic 5.5% |
| French American Indians | 6.1 /100 | #225 | Tragic 5.5% |
| Immigrants | Peru | 5.9 /100 | #226 | Tragic 5.5% |
| Immigrants | Philippines | 5.3 /100 | #227 | Tragic 5.5% |
| Israelis | 4.8 /100 | #228 | Tragic 5.5% |
| Panamanians | 4.7 /100 | #229 | Tragic 5.5% |
| Immigrants | Uruguay | 4.7 /100 | #230 | Tragic 5.5% |
| Immigrants | Iraq | 3.9 /100 | #231 | Tragic 5.5% |
| Liberians | 3.9 /100 | #232 | Tragic 5.5% |
| Moroccans | 3.4 /100 | #233 | Tragic 5.5% |
| Immigrants | Lebanon | 3.3 /100 | #234 | Tragic 5.5% |
| Immigrants | Iran | 3.3 /100 | #235 | Tragic 5.5% |