Immigrants from Latin America vs Immigrants from the Azores Unemployment
COMPARE
Immigrants from Latin America
Immigrants from the Azores
Unemployment
Unemployment Comparison
Immigrants from Latin America
Immigrants from the Azores
5.9%
UNEMPLOYMENT
0.0/ 100
METRIC RATING
275th/ 347
METRIC RANK
6.1%
UNEMPLOYMENT
0.0/ 100
METRIC RATING
282nd/ 347
METRIC RANK
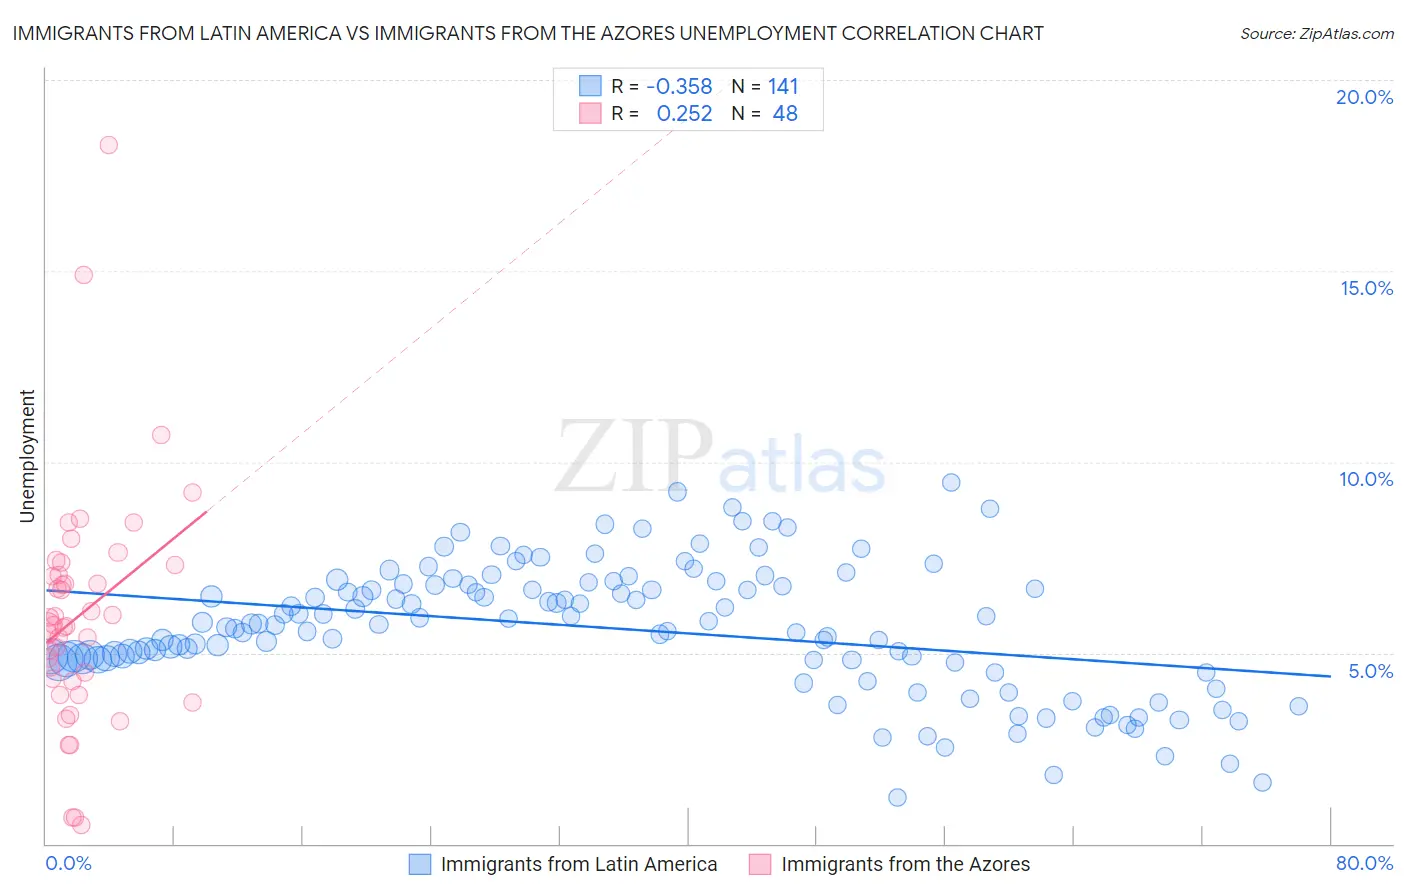
Immigrants from Latin America vs Immigrants from the Azores Unemployment Correlation Chart
The statistical analysis conducted on geographies consisting of 555,896,337 people shows a mild negative correlation between the proportion of Immigrants from Latin America and unemployment in the United States with a correlation coefficient (R) of -0.358 and weighted average of 5.9%. Similarly, the statistical analysis conducted on geographies consisting of 46,243,359 people shows a weak positive correlation between the proportion of Immigrants from the Azores and unemployment in the United States with a correlation coefficient (R) of 0.252 and weighted average of 6.1%, a difference of 2.0%.
Unemployment Correlation Summary
| Measurement | Immigrants from Latin America | Immigrants from the Azores |
| Minimum | 1.2% | 0.50% |
| Maximum | 9.5% | 18.3% |
| Range | 8.3% | 17.8% |
| Mean | 5.6% | 6.0% |
| Median | 5.7% | 5.7% |
| Interquartile 25% (IQ1) | 4.8% | 4.3% |
| Interquartile 75% (IQ3) | 6.8% | 7.2% |
| Interquartile Range (IQR) | 2.0% | 2.9% |
| Standard Deviation (Sample) | 1.7% | 3.1% |
| Standard Deviation (Population) | 1.7% | 3.1% |
Demographics Similar to Immigrants from Latin America and Immigrants from the Azores by Unemployment
In terms of unemployment, the demographic groups most similar to Immigrants from Latin America are Bahamian (5.9%, a difference of 0.21%), Immigrants from Central America (6.0%, a difference of 0.28%), Immigrants from Fiji (5.9%, a difference of 0.50%), Armenian (6.0%, a difference of 0.63%), and Hispanic or Latino (5.9%, a difference of 0.67%). Similarly, the demographic groups most similar to Immigrants from the Azores are African (6.1%, a difference of 0.060%), Immigrants from Ghana (6.1%, a difference of 0.080%), Aleut (6.1%, a difference of 0.21%), Immigrants from Western Africa (6.0%, a difference of 0.64%), and Immigrants from Mexico (6.0%, a difference of 0.65%).
| Demographics | Rating | Rank | Unemployment |
| Immigrants | Sierra Leone | 0.1 /100 | #268 | Tragic 5.8% |
| Immigrants | El Salvador | 0.1 /100 | #269 | Tragic 5.8% |
| Blackfeet | 0.1 /100 | #270 | Tragic 5.8% |
| Mexicans | 0.1 /100 | #271 | Tragic 5.9% |
| Hispanics or Latinos | 0.0 /100 | #272 | Tragic 5.9% |
| Immigrants | Fiji | 0.0 /100 | #273 | Tragic 5.9% |
| Bahamians | 0.0 /100 | #274 | Tragic 5.9% |
| Immigrants | Latin America | 0.0 /100 | #275 | Tragic 5.9% |
| Immigrants | Central America | 0.0 /100 | #276 | Tragic 6.0% |
| Armenians | 0.0 /100 | #277 | Tragic 6.0% |
| Ghanaians | 0.0 /100 | #278 | Tragic 6.0% |
| Immigrants | Mexico | 0.0 /100 | #279 | Tragic 6.0% |
| Immigrants | Western Africa | 0.0 /100 | #280 | Tragic 6.0% |
| Africans | 0.0 /100 | #281 | Tragic 6.1% |
| Immigrants | Azores | 0.0 /100 | #282 | Tragic 6.1% |
| Immigrants | Ghana | 0.0 /100 | #283 | Tragic 6.1% |
| Aleuts | 0.0 /100 | #284 | Tragic 6.1% |
| Immigrants | Senegal | 0.0 /100 | #285 | Tragic 6.1% |
| Immigrants | Caribbean | 0.0 /100 | #286 | Tragic 6.2% |
| Nepalese | 0.0 /100 | #287 | Tragic 6.2% |
| Ecuadorians | 0.0 /100 | #288 | Tragic 6.2% |