Immigrants from Israel vs Immigrants from the Azores Unemployment
COMPARE
Immigrants from Israel
Immigrants from the Azores
Unemployment
Unemployment Comparison
Immigrants from Israel
Immigrants from the Azores
5.3%
UNEMPLOYMENT
28.6/ 100
METRIC RATING
198th/ 347
METRIC RANK
6.1%
UNEMPLOYMENT
0.0/ 100
METRIC RATING
282nd/ 347
METRIC RANK
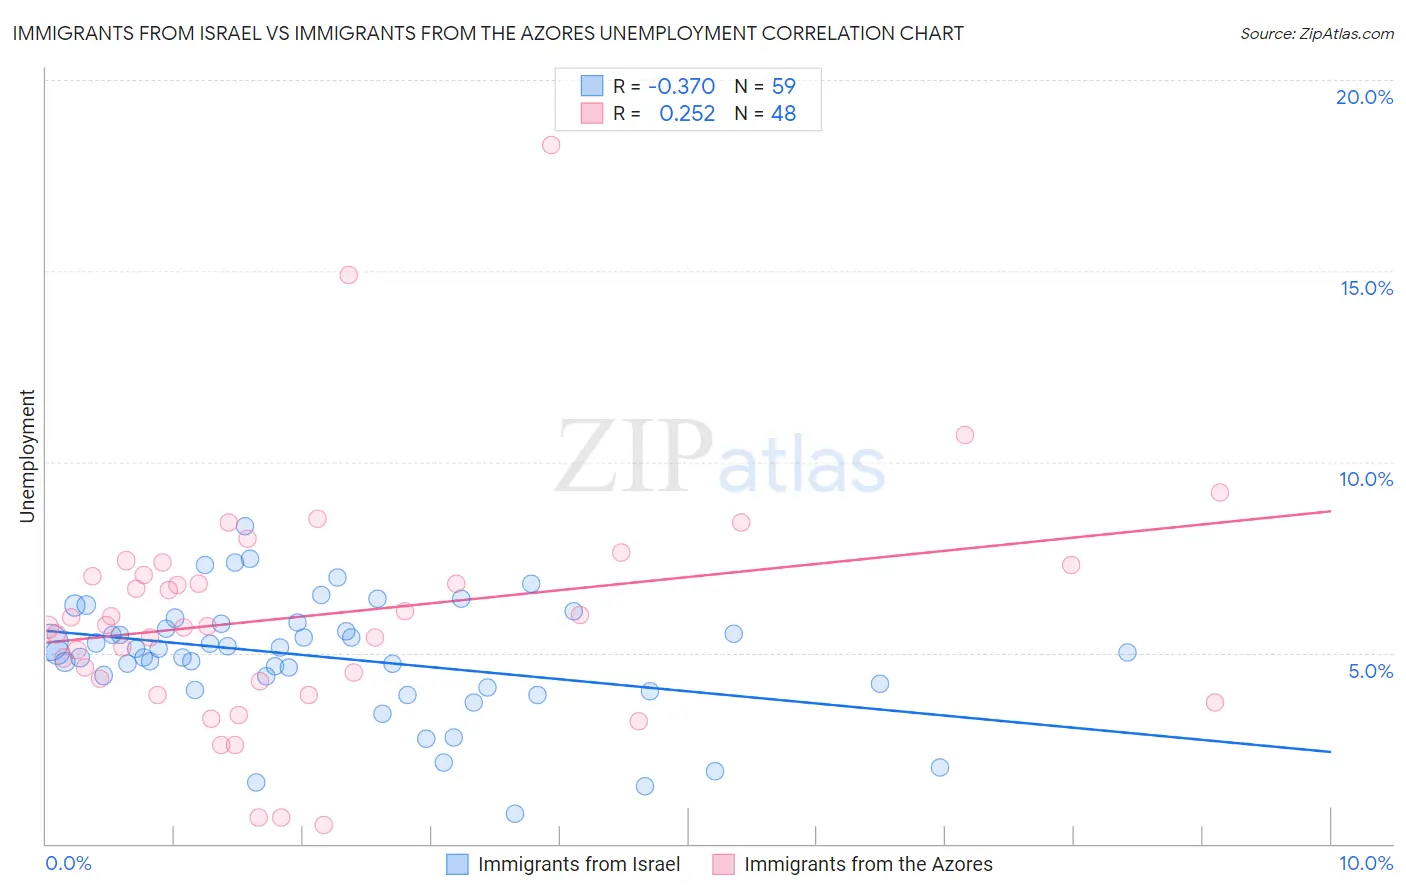
Immigrants from Israel vs Immigrants from the Azores Unemployment Correlation Chart
The statistical analysis conducted on geographies consisting of 209,971,087 people shows a mild negative correlation between the proportion of Immigrants from Israel and unemployment in the United States with a correlation coefficient (R) of -0.370 and weighted average of 5.3%. Similarly, the statistical analysis conducted on geographies consisting of 46,243,359 people shows a weak positive correlation between the proportion of Immigrants from the Azores and unemployment in the United States with a correlation coefficient (R) of 0.252 and weighted average of 6.1%, a difference of 13.6%.
Unemployment Correlation Summary
| Measurement | Immigrants from Israel | Immigrants from the Azores |
| Minimum | 0.80% | 0.50% |
| Maximum | 8.3% | 18.3% |
| Range | 7.5% | 17.8% |
| Mean | 4.9% | 6.0% |
| Median | 5.0% | 5.7% |
| Interquartile 25% (IQ1) | 4.1% | 4.3% |
| Interquartile 75% (IQ3) | 5.7% | 7.2% |
| Interquartile Range (IQR) | 1.6% | 2.9% |
| Standard Deviation (Sample) | 1.5% | 3.1% |
| Standard Deviation (Population) | 1.5% | 3.1% |
Similar Demographics by Unemployment
Demographics Similar to Immigrants from Israel by Unemployment
In terms of unemployment, the demographic groups most similar to Immigrants from Israel are Immigrants from Afghanistan (5.3%, a difference of 0.0%), Peruvian (5.3%, a difference of 0.090%), Immigrants from Uruguay (5.3%, a difference of 0.090%), Korean (5.3%, a difference of 0.090%), and Immigrants from South Eastern Asia (5.3%, a difference of 0.12%).
| Demographics | Rating | Rank | Unemployment |
| Somalis | 34.0 /100 | #191 | Fair 5.3% |
| South Americans | 33.9 /100 | #192 | Fair 5.3% |
| Immigrants | Somalia | 33.8 /100 | #193 | Fair 5.3% |
| Immigrants | Laos | 30.9 /100 | #194 | Fair 5.3% |
| Immigrants | Southern Europe | 30.9 /100 | #195 | Fair 5.3% |
| Peruvians | 29.9 /100 | #196 | Fair 5.3% |
| Immigrants | Uruguay | 29.8 /100 | #197 | Fair 5.3% |
| Immigrants | Israel | 28.6 /100 | #198 | Fair 5.3% |
| Immigrants | Afghanistan | 28.6 /100 | #199 | Fair 5.3% |
| Koreans | 27.4 /100 | #200 | Fair 5.3% |
| Immigrants | South Eastern Asia | 27.0 /100 | #201 | Fair 5.3% |
| Cherokee | 25.5 /100 | #202 | Fair 5.3% |
| Immigrants | Micronesia | 25.2 /100 | #203 | Fair 5.3% |
| Immigrants | Ukraine | 24.9 /100 | #204 | Fair 5.3% |
| Native Hawaiians | 24.1 /100 | #205 | Fair 5.3% |
Demographics Similar to Immigrants from the Azores by Unemployment
In terms of unemployment, the demographic groups most similar to Immigrants from the Azores are African (6.1%, a difference of 0.060%), Immigrants from Ghana (6.1%, a difference of 0.080%), Aleut (6.1%, a difference of 0.21%), Immigrants from Western Africa (6.0%, a difference of 0.64%), and Immigrants from Mexico (6.0%, a difference of 0.65%).
| Demographics | Rating | Rank | Unemployment |
| Immigrants | Latin America | 0.0 /100 | #275 | Tragic 5.9% |
| Immigrants | Central America | 0.0 /100 | #276 | Tragic 6.0% |
| Armenians | 0.0 /100 | #277 | Tragic 6.0% |
| Ghanaians | 0.0 /100 | #278 | Tragic 6.0% |
| Immigrants | Mexico | 0.0 /100 | #279 | Tragic 6.0% |
| Immigrants | Western Africa | 0.0 /100 | #280 | Tragic 6.0% |
| Africans | 0.0 /100 | #281 | Tragic 6.1% |
| Immigrants | Azores | 0.0 /100 | #282 | Tragic 6.1% |
| Immigrants | Ghana | 0.0 /100 | #283 | Tragic 6.1% |
| Aleuts | 0.0 /100 | #284 | Tragic 6.1% |
| Immigrants | Senegal | 0.0 /100 | #285 | Tragic 6.1% |
| Immigrants | Caribbean | 0.0 /100 | #286 | Tragic 6.2% |
| Nepalese | 0.0 /100 | #287 | Tragic 6.2% |
| Ecuadorians | 0.0 /100 | #288 | Tragic 6.2% |
| Chippewa | 0.0 /100 | #289 | Tragic 6.2% |