Italian vs French American Indian Female Unemployment
COMPARE
Italian
French American Indian
Female Unemployment
Female Unemployment Comparison
Italians
French American Indians
4.8%
FEMALE UNEMPLOYMENT
99.5/ 100
METRIC RATING
42nd/ 347
METRIC RANK
5.5%
FEMALE UNEMPLOYMENT
6.1/ 100
METRIC RATING
225th/ 347
METRIC RANK
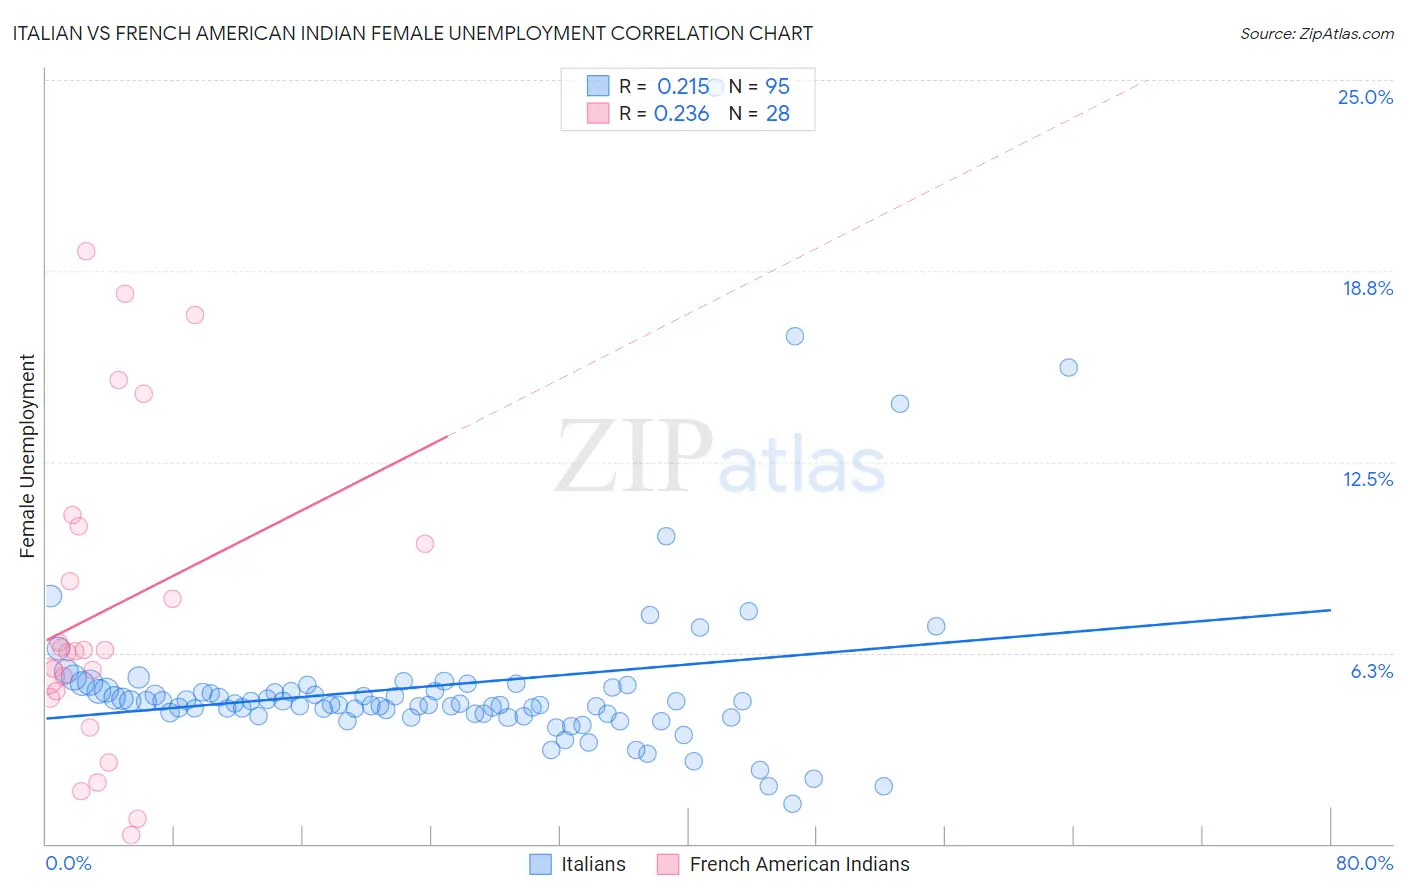
Italian vs French American Indian Female Unemployment Correlation Chart
The statistical analysis conducted on geographies consisting of 560,779,263 people shows a weak positive correlation between the proportion of Italians and unemploymnet rate among females in the United States with a correlation coefficient (R) of 0.215 and weighted average of 4.8%. Similarly, the statistical analysis conducted on geographies consisting of 131,515,161 people shows a weak positive correlation between the proportion of French American Indians and unemploymnet rate among females in the United States with a correlation coefficient (R) of 0.236 and weighted average of 5.5%, a difference of 13.0%.
Female Unemployment Correlation Summary
| Measurement | Italian | French American Indian |
| Minimum | 1.3% | 0.30% |
| Maximum | 24.8% | 19.4% |
| Range | 23.5% | 19.1% |
| Mean | 5.2% | 7.6% |
| Median | 4.6% | 6.3% |
| Interquartile 25% (IQ1) | 4.2% | 4.9% |
| Interquartile 75% (IQ3) | 5.0% | 10.1% |
| Interquartile Range (IQR) | 0.79% | 5.2% |
| Standard Deviation (Sample) | 3.1% | 5.2% |
| Standard Deviation (Population) | 3.0% | 5.1% |
Similar Demographics by Female Unemployment
Demographics Similar to Italians by Female Unemployment
In terms of female unemployment, the demographic groups most similar to Italians are Tongan (4.8%, a difference of 0.13%), Eastern European (4.9%, a difference of 0.17%), Greek (4.9%, a difference of 0.28%), Austrian (4.9%, a difference of 0.36%), and Immigrants from Bulgaria (4.9%, a difference of 0.38%).
| Demographics | Rating | Rank | Female Unemployment |
| French Canadians | 99.7 /100 | #35 | Exceptional 4.8% |
| Yugoslavians | 99.7 /100 | #36 | Exceptional 4.8% |
| Pennsylvania Germans | 99.6 /100 | #37 | Exceptional 4.8% |
| Northern Europeans | 99.6 /100 | #38 | Exceptional 4.8% |
| Scotch-Irish | 99.6 /100 | #39 | Exceptional 4.8% |
| French | 99.6 /100 | #40 | Exceptional 4.8% |
| Tongans | 99.5 /100 | #41 | Exceptional 4.8% |
| Italians | 99.5 /100 | #42 | Exceptional 4.8% |
| Eastern Europeans | 99.4 /100 | #43 | Exceptional 4.9% |
| Greeks | 99.4 /100 | #44 | Exceptional 4.9% |
| Austrians | 99.3 /100 | #45 | Exceptional 4.9% |
| Immigrants | Bulgaria | 99.3 /100 | #46 | Exceptional 4.9% |
| Okinawans | 99.3 /100 | #47 | Exceptional 4.9% |
| Thais | 99.2 /100 | #48 | Exceptional 4.9% |
| Australians | 99.2 /100 | #49 | Exceptional 4.9% |
Demographics Similar to French American Indians by Female Unemployment
In terms of female unemployment, the demographic groups most similar to French American Indians are Immigrants from Peru (5.5%, a difference of 0.040%), Immigrants from Philippines (5.5%, a difference of 0.21%), Iraqi (5.5%, a difference of 0.22%), Delaware (5.5%, a difference of 0.25%), and Nicaraguan (5.5%, a difference of 0.27%).
| Demographics | Rating | Rank | Female Unemployment |
| Bermudans | 9.0 /100 | #218 | Tragic 5.4% |
| South Americans | 8.6 /100 | #219 | Tragic 5.4% |
| Immigrants | Africa | 8.5 /100 | #220 | Tragic 5.4% |
| Brazilians | 7.3 /100 | #221 | Tragic 5.5% |
| Nicaraguans | 7.2 /100 | #222 | Tragic 5.5% |
| Delaware | 7.2 /100 | #223 | Tragic 5.5% |
| Iraqis | 7.1 /100 | #224 | Tragic 5.5% |
| French American Indians | 6.1 /100 | #225 | Tragic 5.5% |
| Immigrants | Peru | 5.9 /100 | #226 | Tragic 5.5% |
| Immigrants | Philippines | 5.3 /100 | #227 | Tragic 5.5% |
| Israelis | 4.8 /100 | #228 | Tragic 5.5% |
| Panamanians | 4.7 /100 | #229 | Tragic 5.5% |
| Immigrants | Uruguay | 4.7 /100 | #230 | Tragic 5.5% |
| Immigrants | Iraq | 3.9 /100 | #231 | Tragic 5.5% |
| Liberians | 3.9 /100 | #232 | Tragic 5.5% |