European vs French American Indian Female Unemployment
COMPARE
European
French American Indian
Female Unemployment
Female Unemployment Comparison
Europeans
French American Indians
4.7%
FEMALE UNEMPLOYMENT
99.9/ 100
METRIC RATING
22nd/ 347
METRIC RANK
5.5%
FEMALE UNEMPLOYMENT
6.1/ 100
METRIC RATING
225th/ 347
METRIC RANK
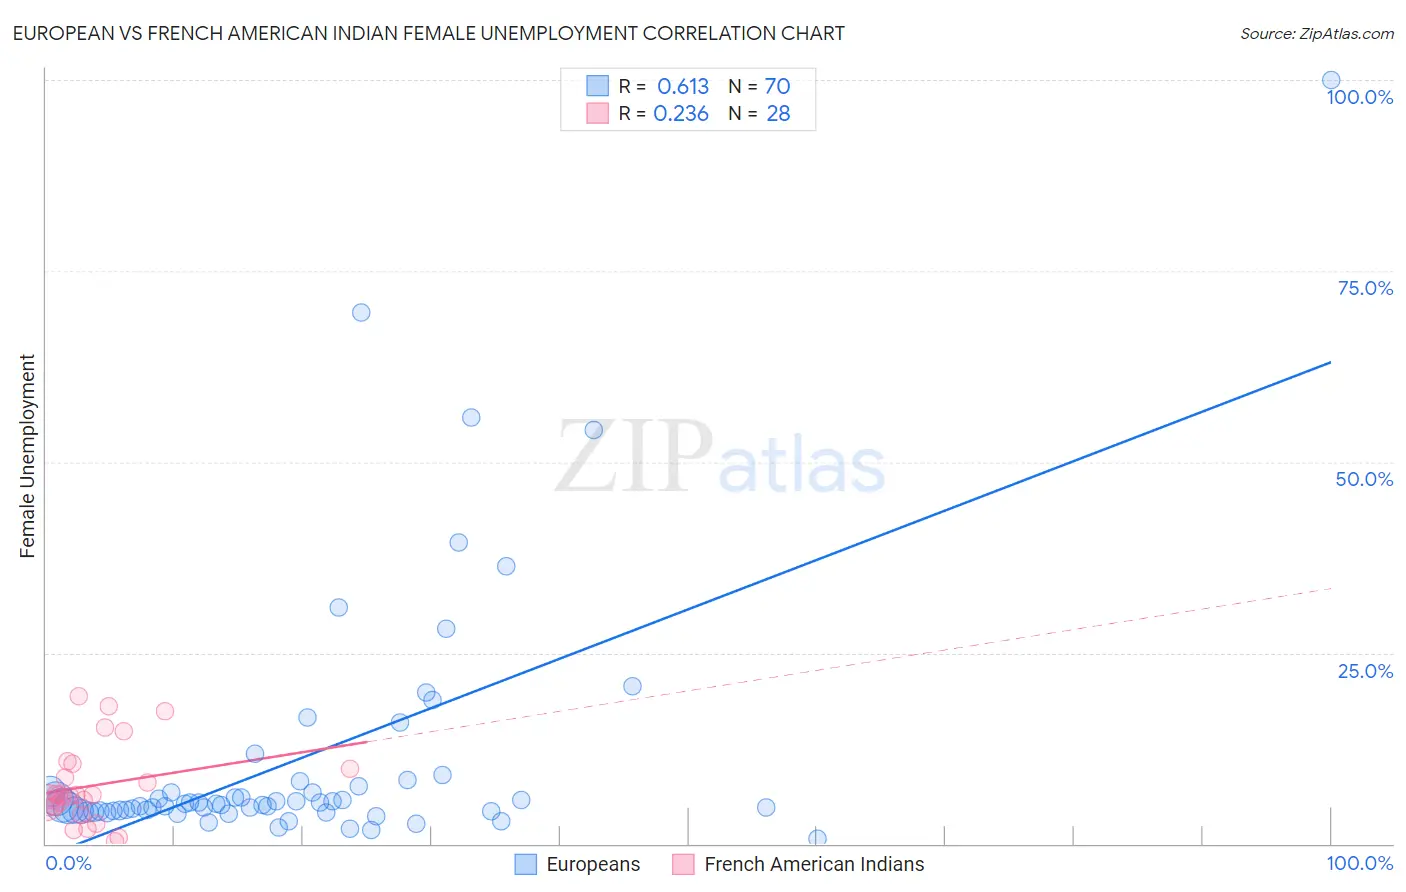
European vs French American Indian Female Unemployment Correlation Chart
The statistical analysis conducted on geographies consisting of 549,789,782 people shows a significant positive correlation between the proportion of Europeans and unemploymnet rate among females in the United States with a correlation coefficient (R) of 0.613 and weighted average of 4.7%. Similarly, the statistical analysis conducted on geographies consisting of 131,515,161 people shows a weak positive correlation between the proportion of French American Indians and unemploymnet rate among females in the United States with a correlation coefficient (R) of 0.236 and weighted average of 5.5%, a difference of 16.8%.
Female Unemployment Correlation Summary
| Measurement | European | French American Indian |
| Minimum | 0.60% | 0.30% |
| Maximum | 100.0% | 19.4% |
| Range | 99.4% | 19.1% |
| Mean | 11.3% | 7.6% |
| Median | 5.2% | 6.3% |
| Interquartile 25% (IQ1) | 4.3% | 4.9% |
| Interquartile 75% (IQ3) | 7.6% | 10.1% |
| Interquartile Range (IQR) | 3.3% | 5.2% |
| Standard Deviation (Sample) | 17.0% | 5.2% |
| Standard Deviation (Population) | 16.9% | 5.1% |
Similar Demographics by Female Unemployment
Demographics Similar to Europeans by Female Unemployment
In terms of female unemployment, the demographic groups most similar to Europeans are Fijian (4.7%, a difference of 0.020%), Bulgarian (4.7%, a difference of 0.030%), Polish (4.7%, a difference of 0.11%), Latvian (4.7%, a difference of 0.12%), and Croatian (4.7%, a difference of 0.26%).
| Demographics | Rating | Rank | Female Unemployment |
| English | 100.0 /100 | #15 | Exceptional 4.6% |
| Carpatho Rusyns | 99.9 /100 | #16 | Exceptional 4.7% |
| Croatians | 99.9 /100 | #17 | Exceptional 4.7% |
| Latvians | 99.9 /100 | #18 | Exceptional 4.7% |
| Poles | 99.9 /100 | #19 | Exceptional 4.7% |
| Bulgarians | 99.9 /100 | #20 | Exceptional 4.7% |
| Fijians | 99.9 /100 | #21 | Exceptional 4.7% |
| Europeans | 99.9 /100 | #22 | Exceptional 4.7% |
| Scottish | 99.9 /100 | #23 | Exceptional 4.7% |
| Welsh | 99.9 /100 | #24 | Exceptional 4.7% |
| Immigrants | India | 99.9 /100 | #25 | Exceptional 4.7% |
| Immigrants | Bosnia and Herzegovina | 99.9 /100 | #26 | Exceptional 4.7% |
| British | 99.9 /100 | #27 | Exceptional 4.7% |
| Irish | 99.9 /100 | #28 | Exceptional 4.7% |
| Cypriots | 99.9 /100 | #29 | Exceptional 4.7% |
Demographics Similar to French American Indians by Female Unemployment
In terms of female unemployment, the demographic groups most similar to French American Indians are Immigrants from Peru (5.5%, a difference of 0.040%), Immigrants from Philippines (5.5%, a difference of 0.21%), Iraqi (5.5%, a difference of 0.22%), Delaware (5.5%, a difference of 0.25%), and Nicaraguan (5.5%, a difference of 0.27%).
| Demographics | Rating | Rank | Female Unemployment |
| Bermudans | 9.0 /100 | #218 | Tragic 5.4% |
| South Americans | 8.6 /100 | #219 | Tragic 5.4% |
| Immigrants | Africa | 8.5 /100 | #220 | Tragic 5.4% |
| Brazilians | 7.3 /100 | #221 | Tragic 5.5% |
| Nicaraguans | 7.2 /100 | #222 | Tragic 5.5% |
| Delaware | 7.2 /100 | #223 | Tragic 5.5% |
| Iraqis | 7.1 /100 | #224 | Tragic 5.5% |
| French American Indians | 6.1 /100 | #225 | Tragic 5.5% |
| Immigrants | Peru | 5.9 /100 | #226 | Tragic 5.5% |
| Immigrants | Philippines | 5.3 /100 | #227 | Tragic 5.5% |
| Israelis | 4.8 /100 | #228 | Tragic 5.5% |
| Panamanians | 4.7 /100 | #229 | Tragic 5.5% |
| Immigrants | Uruguay | 4.7 /100 | #230 | Tragic 5.5% |
| Immigrants | Iraq | 3.9 /100 | #231 | Tragic 5.5% |
| Liberians | 3.9 /100 | #232 | Tragic 5.5% |