Korean vs Finnish Female Unemployment
COMPARE
Korean
Finnish
Female Unemployment
Female Unemployment Comparison
Koreans
Finns
5.4%
FEMALE UNEMPLOYMENT
13.4/ 100
METRIC RATING
209th/ 347
METRIC RANK
4.6%
FEMALE UNEMPLOYMENT
100.0/ 100
METRIC RATING
14th/ 347
METRIC RANK
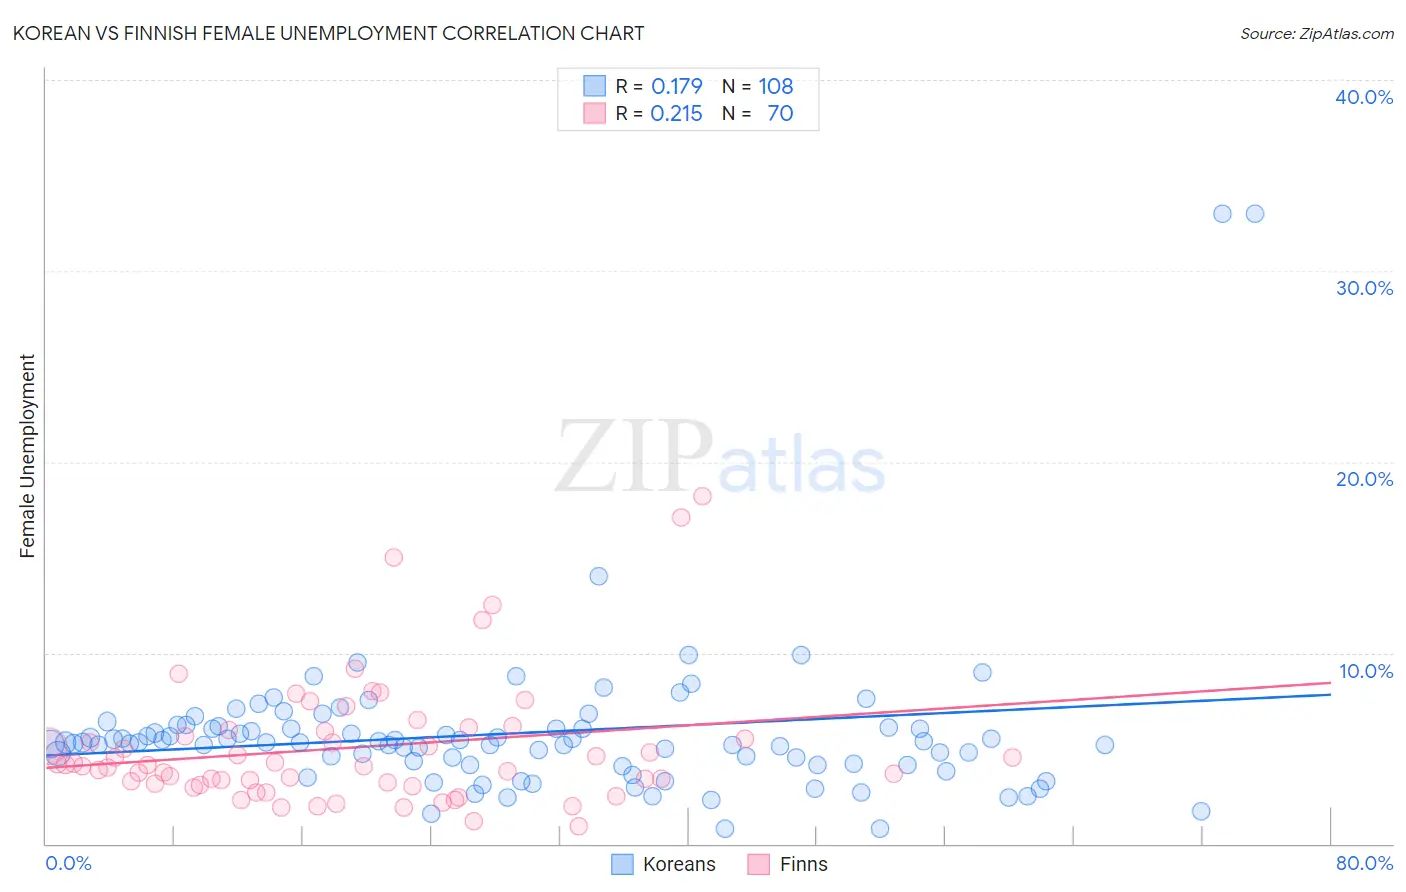
Korean vs Finnish Female Unemployment Correlation Chart
The statistical analysis conducted on geographies consisting of 506,042,019 people shows a poor positive correlation between the proportion of Koreans and unemploymnet rate among females in the United States with a correlation coefficient (R) of 0.179 and weighted average of 5.4%. Similarly, the statistical analysis conducted on geographies consisting of 401,070,094 people shows a weak positive correlation between the proportion of Finns and unemploymnet rate among females in the United States with a correlation coefficient (R) of 0.215 and weighted average of 4.6%, a difference of 16.9%.
Female Unemployment Correlation Summary
| Measurement | Korean | Finnish |
| Minimum | 0.80% | 0.90% |
| Maximum | 33.0% | 18.2% |
| Range | 32.2% | 17.3% |
| Mean | 5.8% | 5.0% |
| Median | 5.3% | 4.1% |
| Interquartile 25% (IQ1) | 4.2% | 3.2% |
| Interquartile 75% (IQ3) | 6.1% | 5.9% |
| Interquartile Range (IQR) | 1.9% | 2.7% |
| Standard Deviation (Sample) | 4.3% | 3.4% |
| Standard Deviation (Population) | 4.2% | 3.3% |
Similar Demographics by Female Unemployment
Demographics Similar to Koreans by Female Unemployment
In terms of female unemployment, the demographic groups most similar to Koreans are Immigrants from Costa Rica (5.4%, a difference of 0.040%), Choctaw (5.4%, a difference of 0.15%), Creek (5.4%, a difference of 0.24%), Ottawa (5.4%, a difference of 0.24%), and Uruguayan (5.4%, a difference of 0.26%).
| Demographics | Rating | Rank | Female Unemployment |
| Iroquois | 20.8 /100 | #202 | Fair 5.4% |
| Immigrants | South Eastern Asia | 20.3 /100 | #203 | Fair 5.4% |
| Immigrants | Israel | 19.7 /100 | #204 | Poor 5.4% |
| Immigrants | Afghanistan | 18.9 /100 | #205 | Poor 5.4% |
| Immigrants | Brazil | 18.8 /100 | #206 | Poor 5.4% |
| Creek | 15.4 /100 | #207 | Poor 5.4% |
| Immigrants | Costa Rica | 13.7 /100 | #208 | Poor 5.4% |
| Koreans | 13.4 /100 | #209 | Poor 5.4% |
| Choctaw | 12.3 /100 | #210 | Poor 5.4% |
| Ottawa | 11.6 /100 | #211 | Poor 5.4% |
| Uruguayans | 11.4 /100 | #212 | Poor 5.4% |
| Samoans | 10.6 /100 | #213 | Poor 5.4% |
| Seminole | 10.3 /100 | #214 | Poor 5.4% |
| Immigrants | Nicaragua | 10.2 /100 | #215 | Poor 5.4% |
| Comanche | 10.0 /100 | #216 | Poor 5.4% |
Demographics Similar to Finns by Female Unemployment
In terms of female unemployment, the demographic groups most similar to Finns are English (4.6%, a difference of 0.20%), Belgian (4.6%, a difference of 0.59%), Dutch (4.6%, a difference of 0.75%), Carpatho Rusyn (4.7%, a difference of 1.1%), and Croatian (4.7%, a difference of 1.1%).
| Demographics | Rating | Rank | Female Unemployment |
| Chinese | 100.0 /100 | #7 | Exceptional 4.5% |
| Germans | 100.0 /100 | #8 | Exceptional 4.5% |
| Slovenes | 100.0 /100 | #9 | Exceptional 4.5% |
| Swiss | 100.0 /100 | #10 | Exceptional 4.6% |
| Scandinavians | 100.0 /100 | #11 | Exceptional 4.6% |
| Dutch | 100.0 /100 | #12 | Exceptional 4.6% |
| Belgians | 100.0 /100 | #13 | Exceptional 4.6% |
| Finns | 100.0 /100 | #14 | Exceptional 4.6% |
| English | 100.0 /100 | #15 | Exceptional 4.6% |
| Carpatho Rusyns | 99.9 /100 | #16 | Exceptional 4.7% |
| Croatians | 99.9 /100 | #17 | Exceptional 4.7% |
| Latvians | 99.9 /100 | #18 | Exceptional 4.7% |
| Poles | 99.9 /100 | #19 | Exceptional 4.7% |
| Bulgarians | 99.9 /100 | #20 | Exceptional 4.7% |
| Fijians | 99.9 /100 | #21 | Exceptional 4.7% |