Kiowa vs Immigrants from Colombia Unemployment Among Women with Children Ages 6 to 17 years
COMPARE
Kiowa
Immigrants from Colombia
Unemployment Among Women with Children Ages 6 to 17 years
Unemployment Among Women with Children Ages 6 to 17 years Comparison
Kiowa
Immigrants from Colombia
9.6%
UNEMPLOYMENT AMONG WOMEN WITH CHILDREN AGES 6 TO 17 YEARS
0.1/ 100
METRIC RATING
272nd/ 347
METRIC RANK
9.3%
UNEMPLOYMENT AMONG WOMEN WITH CHILDREN AGES 6 TO 17 YEARS
2.1/ 100
METRIC RATING
242nd/ 347
METRIC RANK
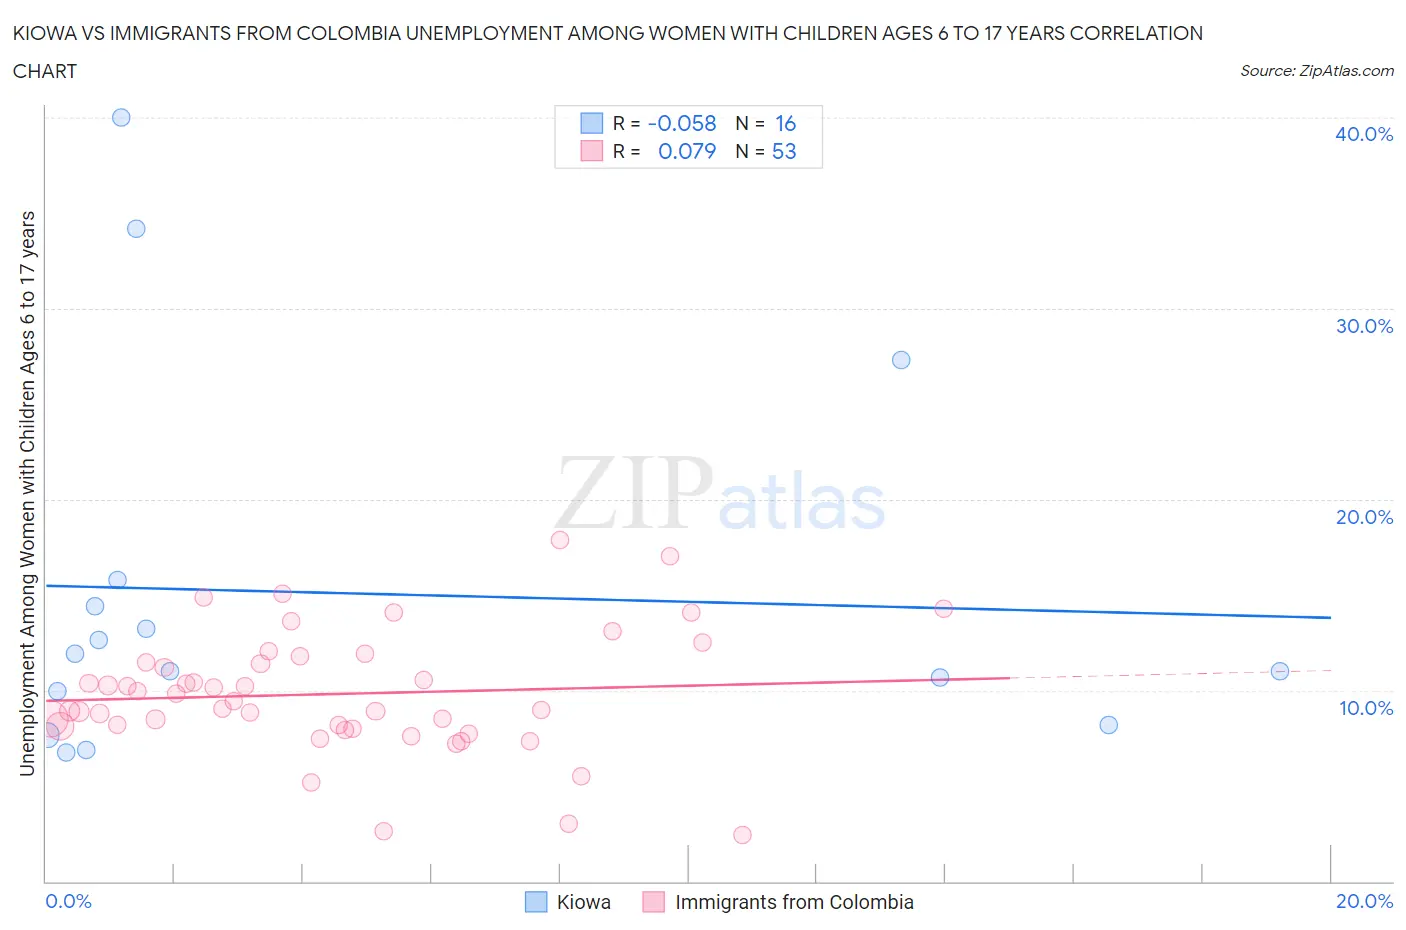
Kiowa vs Immigrants from Colombia Unemployment Among Women with Children Ages 6 to 17 years Correlation Chart
The statistical analysis conducted on geographies consisting of 51,587,484 people shows a slight negative correlation between the proportion of Kiowa and unemployment rate among women with children between the ages 6 and 17 in the United States with a correlation coefficient (R) of -0.058 and weighted average of 9.6%. Similarly, the statistical analysis conducted on geographies consisting of 278,056,309 people shows a slight positive correlation between the proportion of Immigrants from Colombia and unemployment rate among women with children between the ages 6 and 17 in the United States with a correlation coefficient (R) of 0.079 and weighted average of 9.3%, a difference of 3.1%.
Unemployment Among Women with Children Ages 6 to 17 years Correlation Summary
| Measurement | Kiowa | Immigrants from Colombia |
| Minimum | 6.8% | 2.4% |
| Maximum | 40.0% | 17.9% |
| Range | 33.2% | 15.5% |
| Mean | 15.1% | 9.8% |
| Median | 11.5% | 9.4% |
| Interquartile 25% (IQ1) | 9.1% | 8.0% |
| Interquartile 75% (IQ3) | 15.1% | 11.6% |
| Interquartile Range (IQR) | 6.0% | 3.6% |
| Standard Deviation (Sample) | 9.9% | 3.2% |
| Standard Deviation (Population) | 9.6% | 3.2% |
Similar Demographics by Unemployment Among Women with Children Ages 6 to 17 years
Demographics Similar to Kiowa by Unemployment Among Women with Children Ages 6 to 17 years
In terms of unemployment among women with children ages 6 to 17 years, the demographic groups most similar to Kiowa are White/Caucasian (9.6%, a difference of 0.010%), Immigrants from Latin America (9.6%, a difference of 0.060%), Aleut (9.6%, a difference of 0.060%), Immigrants from Nicaragua (9.6%, a difference of 0.46%), and U.S. Virgin Islander (9.7%, a difference of 0.50%).
| Demographics | Rating | Rank | Unemployment Among Women with Children Ages 6 to 17 years |
| West Indians | 0.4 /100 | #265 | Tragic 9.5% |
| Immigrants | Jamaica | 0.3 /100 | #266 | Tragic 9.5% |
| Irish | 0.3 /100 | #267 | Tragic 9.5% |
| Ghanaians | 0.2 /100 | #268 | Tragic 9.6% |
| Blackfeet | 0.2 /100 | #269 | Tragic 9.6% |
| Immigrants | Nicaragua | 0.2 /100 | #270 | Tragic 9.6% |
| Immigrants | Latin America | 0.1 /100 | #271 | Tragic 9.6% |
| Kiowa | 0.1 /100 | #272 | Tragic 9.6% |
| Whites/Caucasians | 0.1 /100 | #273 | Tragic 9.6% |
| Aleuts | 0.1 /100 | #274 | Tragic 9.6% |
| U.S. Virgin Islanders | 0.1 /100 | #275 | Tragic 9.7% |
| Immigrants | Portugal | 0.1 /100 | #276 | Tragic 9.7% |
| British West Indians | 0.1 /100 | #277 | Tragic 9.7% |
| French | 0.1 /100 | #278 | Tragic 9.7% |
| Scotch-Irish | 0.1 /100 | #279 | Tragic 9.7% |
Demographics Similar to Immigrants from Colombia by Unemployment Among Women with Children Ages 6 to 17 years
In terms of unemployment among women with children ages 6 to 17 years, the demographic groups most similar to Immigrants from Colombia are Colombian (9.3%, a difference of 0.020%), Guatemalan (9.3%, a difference of 0.090%), Scottish (9.4%, a difference of 0.090%), English (9.4%, a difference of 0.14%), and Immigrants from Cameroon (9.4%, a difference of 0.17%).
| Demographics | Rating | Rank | Unemployment Among Women with Children Ages 6 to 17 years |
| Uruguayans | 3.0 /100 | #235 | Tragic 9.3% |
| Hungarians | 3.0 /100 | #236 | Tragic 9.3% |
| Immigrants | Belize | 2.8 /100 | #237 | Tragic 9.3% |
| Arabs | 2.7 /100 | #238 | Tragic 9.3% |
| Immigrants | Saudi Arabia | 2.7 /100 | #239 | Tragic 9.3% |
| Guatemalans | 2.3 /100 | #240 | Tragic 9.3% |
| Colombians | 2.2 /100 | #241 | Tragic 9.3% |
| Immigrants | Colombia | 2.1 /100 | #242 | Tragic 9.3% |
| Scottish | 2.0 /100 | #243 | Tragic 9.4% |
| English | 1.9 /100 | #244 | Tragic 9.4% |
| Immigrants | Cameroon | 1.8 /100 | #245 | Tragic 9.4% |
| Immigrants | Africa | 1.6 /100 | #246 | Tragic 9.4% |
| Poles | 1.5 /100 | #247 | Tragic 9.4% |
| Dutch | 1.5 /100 | #248 | Tragic 9.4% |
| Immigrants | South America | 1.5 /100 | #249 | Tragic 9.4% |