Jamaican vs Celtic Unemployment
COMPARE
Jamaican
Celtic
Unemployment
Unemployment Comparison
Jamaicans
Celtics
6.3%
UNEMPLOYMENT
0.0/ 100
METRIC RATING
297th/ 347
METRIC RANK
4.9%
UNEMPLOYMENT
99.1/ 100
METRIC RATING
56th/ 347
METRIC RANK
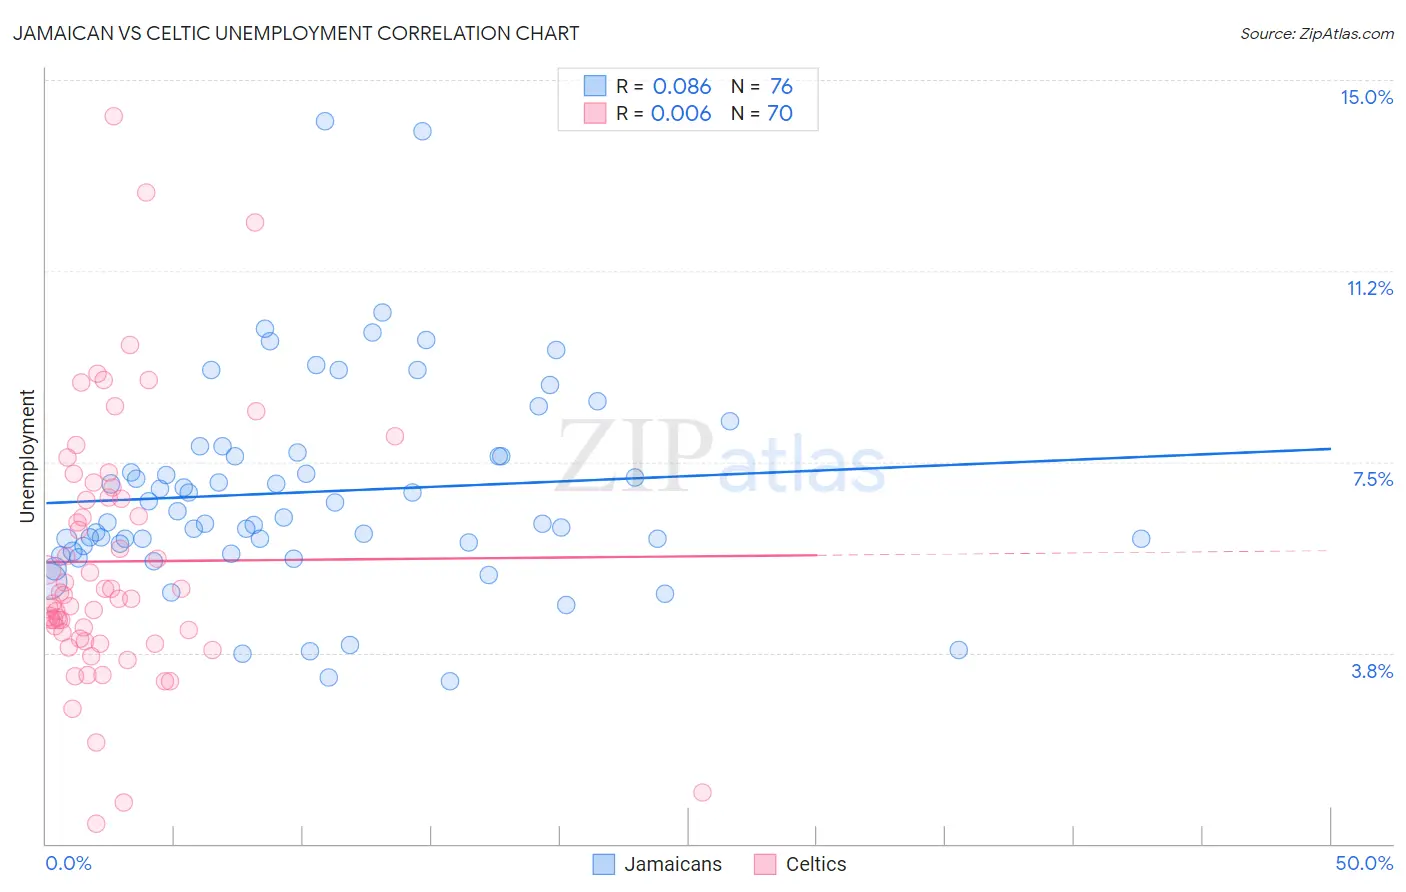
Jamaican vs Celtic Unemployment Correlation Chart
The statistical analysis conducted on geographies consisting of 367,761,379 people shows a slight positive correlation between the proportion of Jamaicans and unemployment in the United States with a correlation coefficient (R) of 0.086 and weighted average of 6.3%. Similarly, the statistical analysis conducted on geographies consisting of 168,747,363 people shows no correlation between the proportion of Celtics and unemployment in the United States with a correlation coefficient (R) of 0.006 and weighted average of 4.9%, a difference of 29.1%.
Unemployment Correlation Summary
| Measurement | Jamaican | Celtic |
| Minimum | 3.2% | 0.40% |
| Maximum | 14.2% | 14.3% |
| Range | 11.0% | 13.9% |
| Mean | 6.9% | 5.5% |
| Median | 6.4% | 4.8% |
| Interquartile 25% (IQ1) | 5.9% | 4.0% |
| Interquartile 75% (IQ3) | 7.7% | 6.8% |
| Interquartile Range (IQR) | 1.8% | 2.8% |
| Standard Deviation (Sample) | 2.0% | 2.6% |
| Standard Deviation (Population) | 2.0% | 2.6% |
Similar Demographics by Unemployment
Demographics Similar to Jamaicans by Unemployment
In terms of unemployment, the demographic groups most similar to Jamaicans are Immigrants from Haiti (6.3%, a difference of 0.090%), Immigrants from West Indies (6.3%, a difference of 0.14%), Immigrants from Trinidad and Tobago (6.3%, a difference of 0.26%), Ute (6.3%, a difference of 0.34%), and Trinidadian and Tobagonian (6.3%, a difference of 0.74%).
| Demographics | Rating | Rank | Unemployment |
| Senegalese | 0.0 /100 | #290 | Tragic 6.2% |
| Haitians | 0.0 /100 | #291 | Tragic 6.2% |
| Central American Indians | 0.0 /100 | #292 | Tragic 6.2% |
| Immigrants | Ecuador | 0.0 /100 | #293 | Tragic 6.2% |
| Spanish American Indians | 0.0 /100 | #294 | Tragic 6.2% |
| U.S. Virgin Islanders | 0.0 /100 | #295 | Tragic 6.3% |
| Ute | 0.0 /100 | #296 | Tragic 6.3% |
| Jamaicans | 0.0 /100 | #297 | Tragic 6.3% |
| Immigrants | Haiti | 0.0 /100 | #298 | Tragic 6.3% |
| Immigrants | West Indies | 0.0 /100 | #299 | Tragic 6.3% |
| Immigrants | Trinidad and Tobago | 0.0 /100 | #300 | Tragic 6.3% |
| Trinidadians and Tobagonians | 0.0 /100 | #301 | Tragic 6.3% |
| West Indians | 0.0 /100 | #302 | Tragic 6.4% |
| Belizeans | 0.0 /100 | #303 | Tragic 6.4% |
| Immigrants | Jamaica | 0.0 /100 | #304 | Tragic 6.4% |
Demographics Similar to Celtics by Unemployment
In terms of unemployment, the demographic groups most similar to Celtics are Immigrants from Singapore (4.9%, a difference of 0.070%), Australian (4.9%, a difference of 0.16%), Greek (4.9%, a difference of 0.17%), Eastern European (4.9%, a difference of 0.19%), and Bhutanese (4.9%, a difference of 0.20%).
| Demographics | Rating | Rank | Unemployment |
| Immigrants | South Central Asia | 99.3 /100 | #49 | Exceptional 4.9% |
| French Canadians | 99.3 /100 | #50 | Exceptional 4.9% |
| Immigrants | Belgium | 99.2 /100 | #51 | Exceptional 4.9% |
| Whites/Caucasians | 99.2 /100 | #52 | Exceptional 4.9% |
| Immigrants | Zimbabwe | 99.2 /100 | #53 | Exceptional 4.9% |
| Eastern Europeans | 99.2 /100 | #54 | Exceptional 4.9% |
| Australians | 99.2 /100 | #55 | Exceptional 4.9% |
| Celtics | 99.1 /100 | #56 | Exceptional 4.9% |
| Immigrants | Singapore | 99.1 /100 | #57 | Exceptional 4.9% |
| Greeks | 99.0 /100 | #58 | Exceptional 4.9% |
| Bhutanese | 99.0 /100 | #59 | Exceptional 4.9% |
| Immigrants | Netherlands | 99.0 /100 | #60 | Exceptional 4.9% |
| Cambodians | 99.0 /100 | #61 | Exceptional 4.9% |
| Icelanders | 98.9 /100 | #62 | Exceptional 4.9% |
| Immigrants | Bulgaria | 98.9 /100 | #63 | Exceptional 4.9% |