Jamaican vs Basque Unemployment Among Women with Children Ages 6 to 17 years
COMPARE
Jamaican
Basque
Unemployment Among Women with Children Ages 6 to 17 years
Unemployment Among Women with Children Ages 6 to 17 years Comparison
Jamaicans
Basques
9.8%
UNEMPLOYMENT AMONG WOMEN WITH CHILDREN AGES 6 TO 17 YEARS
0.0/ 100
METRIC RATING
281st/ 347
METRIC RANK
8.2%
UNEMPLOYMENT AMONG WOMEN WITH CHILDREN AGES 6 TO 17 YEARS
100.0/ 100
METRIC RATING
60th/ 347
METRIC RANK
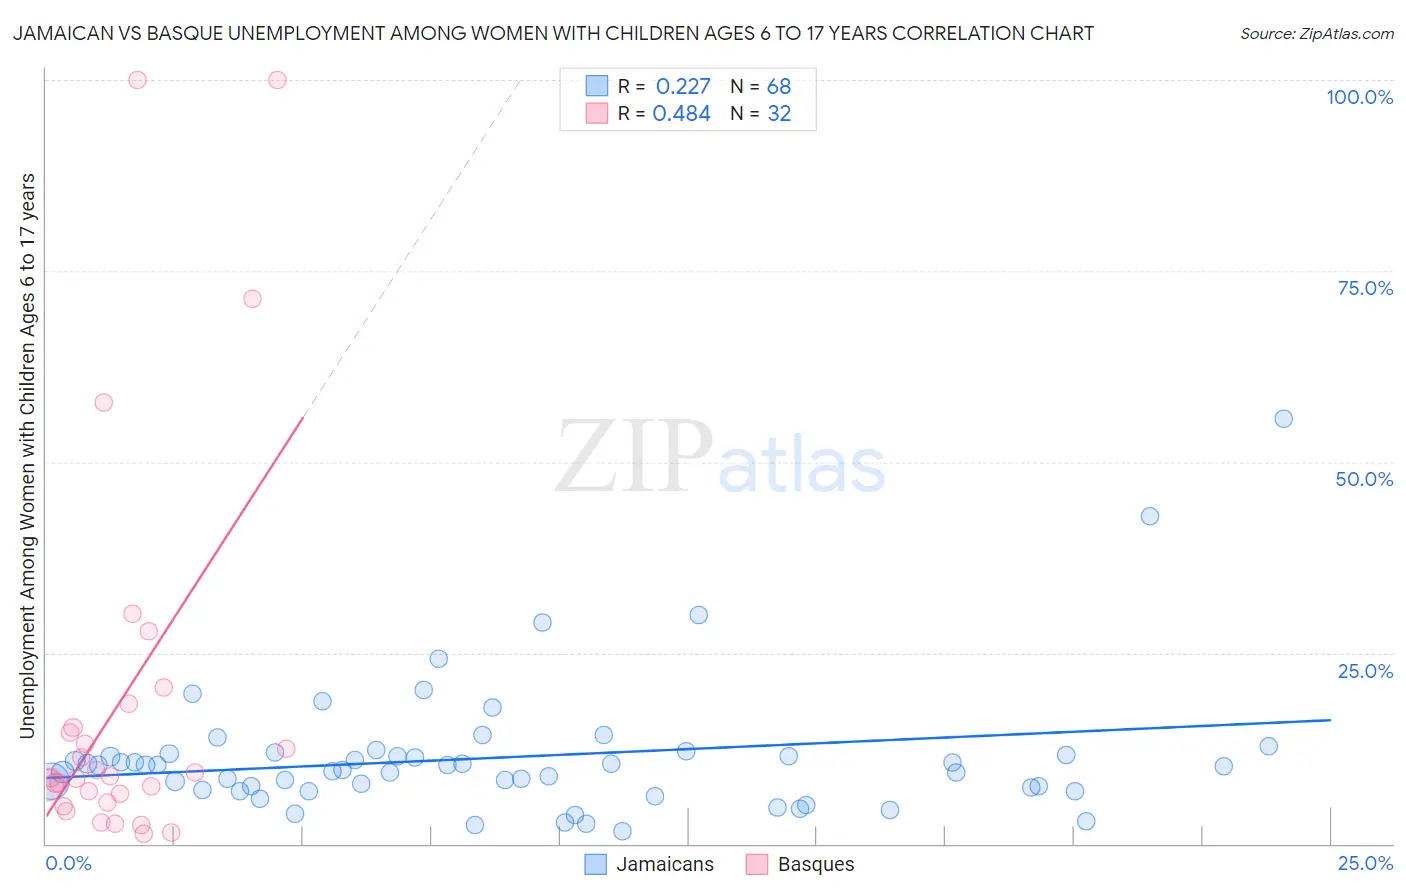
Jamaican vs Basque Unemployment Among Women with Children Ages 6 to 17 years Correlation Chart
The statistical analysis conducted on geographies consisting of 272,557,643 people shows a weak positive correlation between the proportion of Jamaicans and unemployment rate among women with children between the ages 6 and 17 in the United States with a correlation coefficient (R) of 0.227 and weighted average of 9.8%. Similarly, the statistical analysis conducted on geographies consisting of 136,984,140 people shows a moderate positive correlation between the proportion of Basques and unemployment rate among women with children between the ages 6 and 17 in the United States with a correlation coefficient (R) of 0.484 and weighted average of 8.2%, a difference of 19.4%.
Unemployment Among Women with Children Ages 6 to 17 years Correlation Summary
| Measurement | Jamaican | Basque |
| Minimum | 1.6% | 1.3% |
| Maximum | 55.7% | 100.0% |
| Range | 54.1% | 98.7% |
| Mean | 11.3% | 19.0% |
| Median | 10.2% | 8.7% |
| Interquartile 25% (IQ1) | 7.2% | 6.0% |
| Interquartile 75% (IQ3) | 11.8% | 16.8% |
| Interquartile Range (IQR) | 4.6% | 10.8% |
| Standard Deviation (Sample) | 8.6% | 26.1% |
| Standard Deviation (Population) | 8.6% | 25.7% |
Similar Demographics by Unemployment Among Women with Children Ages 6 to 17 years
Demographics Similar to Jamaicans by Unemployment Among Women with Children Ages 6 to 17 years
In terms of unemployment among women with children ages 6 to 17 years, the demographic groups most similar to Jamaicans are Slovak (9.8%, a difference of 0.23%), Seminole (9.7%, a difference of 0.53%), Scotch-Irish (9.7%, a difference of 0.72%), French (9.7%, a difference of 0.75%), and British West Indian (9.7%, a difference of 0.82%).
| Demographics | Rating | Rank | Unemployment Among Women with Children Ages 6 to 17 years |
| Aleuts | 0.1 /100 | #274 | Tragic 9.6% |
| U.S. Virgin Islanders | 0.1 /100 | #275 | Tragic 9.7% |
| Immigrants | Portugal | 0.1 /100 | #276 | Tragic 9.7% |
| British West Indians | 0.1 /100 | #277 | Tragic 9.7% |
| French | 0.1 /100 | #278 | Tragic 9.7% |
| Scotch-Irish | 0.1 /100 | #279 | Tragic 9.7% |
| Seminole | 0.1 /100 | #280 | Tragic 9.7% |
| Jamaicans | 0.0 /100 | #281 | Tragic 9.8% |
| Slovaks | 0.0 /100 | #282 | Tragic 9.8% |
| Central American Indians | 0.0 /100 | #283 | Tragic 9.9% |
| Yakama | 0.0 /100 | #284 | Tragic 9.9% |
| Hispanics or Latinos | 0.0 /100 | #285 | Tragic 9.9% |
| Choctaw | 0.0 /100 | #286 | Tragic 9.9% |
| Sierra Leoneans | 0.0 /100 | #287 | Tragic 9.9% |
| Shoshone | 0.0 /100 | #288 | Tragic 10.0% |
Demographics Similar to Basques by Unemployment Among Women with Children Ages 6 to 17 years
In terms of unemployment among women with children ages 6 to 17 years, the demographic groups most similar to Basques are Immigrants from Philippines (8.2%, a difference of 0.0%), Immigrants from Malaysia (8.2%, a difference of 0.070%), Korean (8.2%, a difference of 0.18%), Spanish American Indian (8.2%, a difference of 0.22%), and Immigrants from Laos (8.2%, a difference of 0.26%).
| Demographics | Rating | Rank | Unemployment Among Women with Children Ages 6 to 17 years |
| Danes | 100.0 /100 | #53 | Exceptional 8.1% |
| Immigrants | Armenia | 100.0 /100 | #54 | Exceptional 8.2% |
| Immigrants | Japan | 100.0 /100 | #55 | Exceptional 8.2% |
| Immigrants | Bosnia and Herzegovina | 100.0 /100 | #56 | Exceptional 8.2% |
| Immigrants | Laos | 100.0 /100 | #57 | Exceptional 8.2% |
| Immigrants | Malaysia | 100.0 /100 | #58 | Exceptional 8.2% |
| Immigrants | Philippines | 100.0 /100 | #59 | Exceptional 8.2% |
| Basques | 100.0 /100 | #60 | Exceptional 8.2% |
| Koreans | 100.0 /100 | #61 | Exceptional 8.2% |
| Spanish American Indians | 100.0 /100 | #62 | Exceptional 8.2% |
| Immigrants | South Eastern Asia | 99.9 /100 | #63 | Exceptional 8.2% |
| Immigrants | Kuwait | 99.9 /100 | #64 | Exceptional 8.3% |
| Immigrants | Albania | 99.9 /100 | #65 | Exceptional 8.3% |
| Luxembourgers | 99.9 /100 | #66 | Exceptional 8.3% |
| Armenians | 99.9 /100 | #67 | Exceptional 8.3% |