Jamaican vs Basque 4th Grade
COMPARE
Jamaican
Basque
4th Grade
4th Grade Comparison
Jamaicans
Basques
97.1%
4TH GRADE
0.8/ 100
METRIC RATING
252nd/ 347
METRIC RANK
97.8%
4TH GRADE
95.8/ 100
METRIC RATING
113th/ 347
METRIC RANK
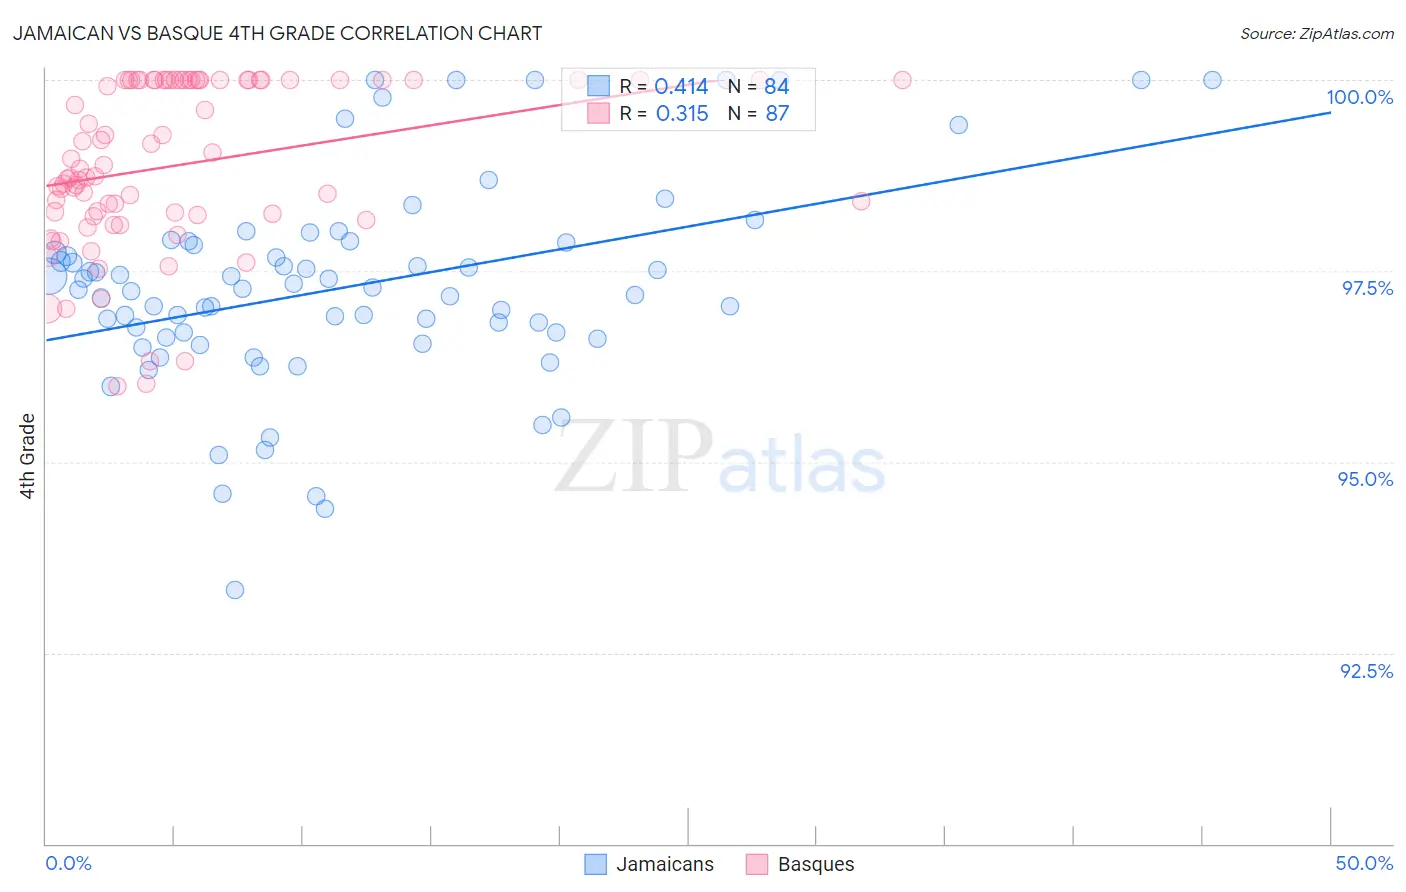
Jamaican vs Basque 4th Grade Correlation Chart
The statistical analysis conducted on geographies consisting of 368,084,189 people shows a moderate positive correlation between the proportion of Jamaicans and percentage of population with at least 4th grade education in the United States with a correlation coefficient (R) of 0.414 and weighted average of 97.1%. Similarly, the statistical analysis conducted on geographies consisting of 165,774,137 people shows a mild positive correlation between the proportion of Basques and percentage of population with at least 4th grade education in the United States with a correlation coefficient (R) of 0.315 and weighted average of 97.8%, a difference of 0.75%.
4th Grade Correlation Summary
| Measurement | Jamaican | Basque |
| Minimum | 93.3% | 96.0% |
| Maximum | 100.0% | 100.0% |
| Range | 6.7% | 4.0% |
| Mean | 97.3% | 98.9% |
| Median | 97.3% | 98.8% |
| Interquartile 25% (IQ1) | 96.7% | 98.2% |
| Interquartile 75% (IQ3) | 97.9% | 100.0% |
| Interquartile Range (IQR) | 1.2% | 1.8% |
| Standard Deviation (Sample) | 1.3% | 1.1% |
| Standard Deviation (Population) | 1.3% | 1.1% |
Similar Demographics by 4th Grade
Demographics Similar to Jamaicans by 4th Grade
In terms of 4th grade, the demographic groups most similar to Jamaicans are South American (97.1%, a difference of 0.0%), Immigrants from Liberia (97.1%, a difference of 0.0%), Immigrants from Middle Africa (97.1%, a difference of 0.0%), Immigrants from Africa (97.1%, a difference of 0.010%), and Immigrants from Senegal (97.1%, a difference of 0.010%).
| Demographics | Rating | Rank | 4th Grade |
| Immigrants | Eastern Africa | 1.2 /100 | #245 | Tragic 97.1% |
| Immigrants | Uruguay | 1.2 /100 | #246 | Tragic 97.1% |
| Ethiopians | 1.2 /100 | #247 | Tragic 97.1% |
| Immigrants | Asia | 1.2 /100 | #248 | Tragic 97.1% |
| Immigrants | Africa | 1.0 /100 | #249 | Tragic 97.1% |
| Immigrants | Senegal | 0.9 /100 | #250 | Tragic 97.1% |
| South Americans | 0.8 /100 | #251 | Tragic 97.1% |
| Jamaicans | 0.8 /100 | #252 | Tragic 97.1% |
| Immigrants | Liberia | 0.8 /100 | #253 | Tragic 97.1% |
| Immigrants | Middle Africa | 0.8 /100 | #254 | Tragic 97.1% |
| Peruvians | 0.7 /100 | #255 | Tragic 97.1% |
| Bolivians | 0.7 /100 | #256 | Tragic 97.1% |
| Immigrants | Congo | 0.5 /100 | #257 | Tragic 97.0% |
| Immigrants | Colombia | 0.5 /100 | #258 | Tragic 97.0% |
| Immigrants | Ethiopia | 0.4 /100 | #259 | Tragic 97.0% |
Demographics Similar to Basques by 4th Grade
In terms of 4th grade, the demographic groups most similar to Basques are Okinawan (97.8%, a difference of 0.0%), Immigrants from Switzerland (97.8%, a difference of 0.010%), Iroquois (97.8%, a difference of 0.010%), Lebanese (97.8%, a difference of 0.010%), and Immigrants from Croatia (97.8%, a difference of 0.010%).
| Demographics | Rating | Rank | 4th Grade |
| Immigrants | Czechoslovakia | 97.5 /100 | #106 | Exceptional 97.9% |
| Bhutanese | 97.4 /100 | #107 | Exceptional 97.9% |
| Immigrants | Singapore | 97.3 /100 | #108 | Exceptional 97.9% |
| Immigrants | Latvia | 96.8 /100 | #109 | Exceptional 97.8% |
| Thais | 96.7 /100 | #110 | Exceptional 97.8% |
| Immigrants | Switzerland | 96.1 /100 | #111 | Exceptional 97.8% |
| Okinawans | 96.0 /100 | #112 | Exceptional 97.8% |
| Basques | 95.8 /100 | #113 | Exceptional 97.8% |
| Iroquois | 95.4 /100 | #114 | Exceptional 97.8% |
| Lebanese | 95.4 /100 | #115 | Exceptional 97.8% |
| Immigrants | Croatia | 95.2 /100 | #116 | Exceptional 97.8% |
| Syrians | 94.9 /100 | #117 | Exceptional 97.8% |
| Menominee | 94.9 /100 | #118 | Exceptional 97.8% |
| Immigrants | Saudi Arabia | 94.8 /100 | #119 | Exceptional 97.8% |
| Immigrants | France | 94.8 /100 | #120 | Exceptional 97.8% |