Iraqi vs Immigrants from Serbia Unemployment
COMPARE
Iraqi
Immigrants from Serbia
Unemployment
Unemployment Comparison
Iraqis
Immigrants from Serbia
5.4%
UNEMPLOYMENT
18.1/ 100
METRIC RATING
211th/ 347
METRIC RANK
5.0%
UNEMPLOYMENT
95.6/ 100
METRIC RATING
95th/ 347
METRIC RANK
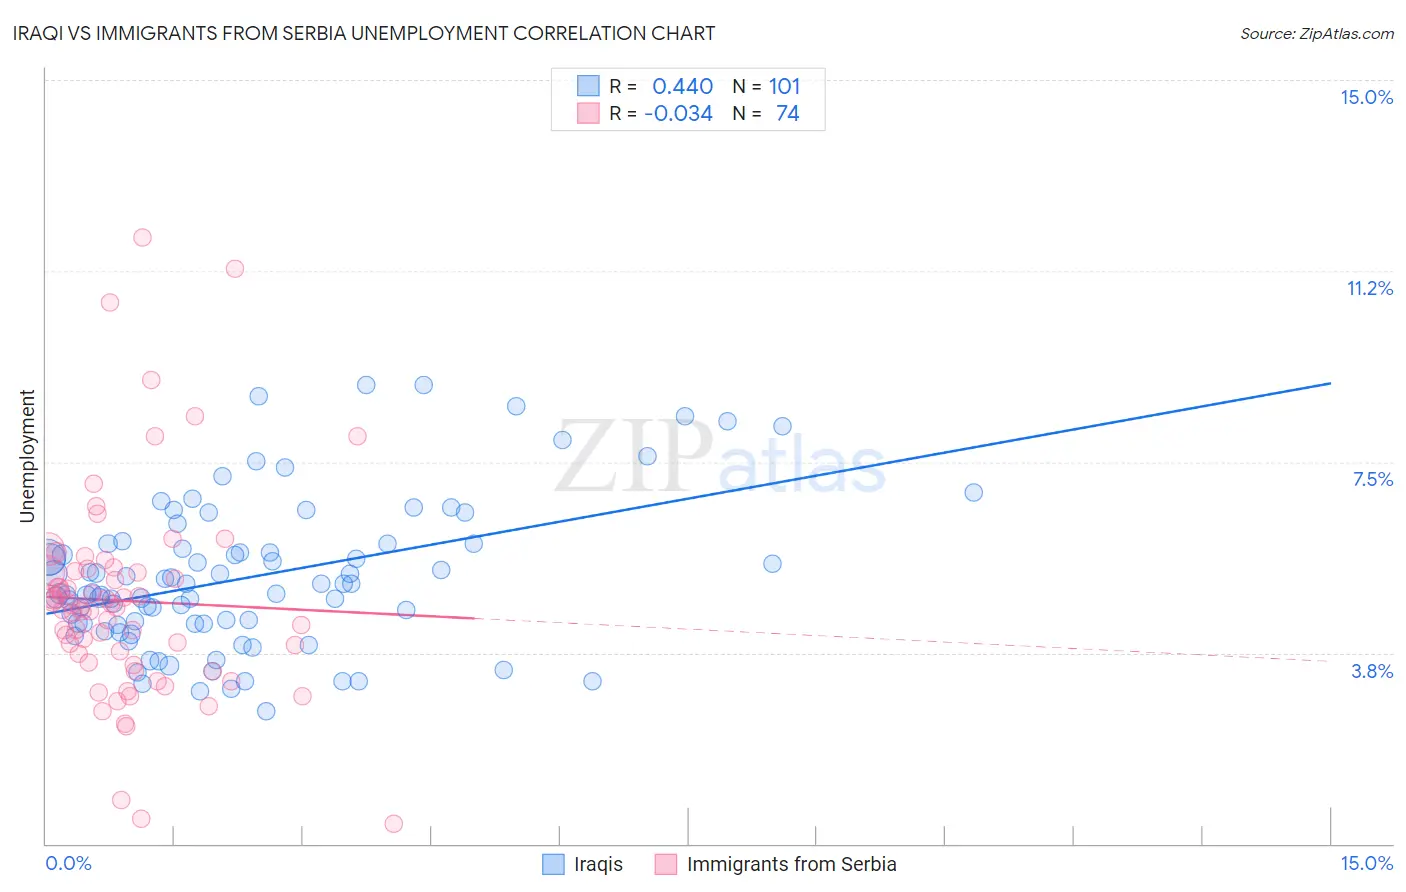
Iraqi vs Immigrants from Serbia Unemployment Correlation Chart
The statistical analysis conducted on geographies consisting of 170,626,447 people shows a moderate positive correlation between the proportion of Iraqis and unemployment in the United States with a correlation coefficient (R) of 0.440 and weighted average of 5.4%. Similarly, the statistical analysis conducted on geographies consisting of 131,730,582 people shows no correlation between the proportion of Immigrants from Serbia and unemployment in the United States with a correlation coefficient (R) of -0.034 and weighted average of 5.0%, a difference of 7.4%.
Unemployment Correlation Summary
| Measurement | Iraqi | Immigrants from Serbia |
| Minimum | 2.6% | 0.40% |
| Maximum | 9.0% | 11.9% |
| Range | 6.4% | 11.5% |
| Mean | 5.2% | 4.8% |
| Median | 4.9% | 4.6% |
| Interquartile 25% (IQ1) | 4.3% | 3.6% |
| Interquartile 75% (IQ3) | 5.9% | 5.4% |
| Interquartile Range (IQR) | 1.6% | 1.8% |
| Standard Deviation (Sample) | 1.5% | 2.1% |
| Standard Deviation (Population) | 1.4% | 2.1% |
Similar Demographics by Unemployment
Demographics Similar to Iraqis by Unemployment
In terms of unemployment, the demographic groups most similar to Iraqis are Ugandan (5.4%, a difference of 0.010%), Immigrants from Iraq (5.4%, a difference of 0.050%), Immigrants from Iran (5.4%, a difference of 0.070%), Portuguese (5.4%, a difference of 0.10%), and Creek (5.4%, a difference of 0.13%).
| Demographics | Rating | Rank | Unemployment |
| Immigrants | Ukraine | 24.9 /100 | #204 | Fair 5.3% |
| Native Hawaiians | 24.1 /100 | #205 | Fair 5.3% |
| Immigrants | Peru | 22.7 /100 | #206 | Fair 5.4% |
| Creek | 19.4 /100 | #207 | Poor 5.4% |
| Portuguese | 19.0 /100 | #208 | Poor 5.4% |
| Immigrants | Iran | 18.8 /100 | #209 | Poor 5.4% |
| Immigrants | Iraq | 18.6 /100 | #210 | Poor 5.4% |
| Iraqis | 18.1 /100 | #211 | Poor 5.4% |
| Ugandans | 18.0 /100 | #212 | Poor 5.4% |
| Immigrants | Middle Africa | 15.3 /100 | #213 | Poor 5.4% |
| Immigrants | Costa Rica | 15.2 /100 | #214 | Poor 5.4% |
| Delaware | 14.7 /100 | #215 | Poor 5.4% |
| Immigrants | South America | 13.5 /100 | #216 | Poor 5.4% |
| Immigrants | Albania | 13.5 /100 | #217 | Poor 5.4% |
| Choctaw | 12.7 /100 | #218 | Poor 5.4% |
Demographics Similar to Immigrants from Serbia by Unemployment
In terms of unemployment, the demographic groups most similar to Immigrants from Serbia are Immigrants from Austria (5.0%, a difference of 0.13%), Immigrants from England (5.0%, a difference of 0.16%), Ukrainian (5.0%, a difference of 0.17%), Immigrants from Czechoslovakia (5.0%, a difference of 0.19%), and Romanian (5.0%, a difference of 0.22%).
| Demographics | Rating | Rank | Unemployment |
| Immigrants | Korea | 96.6 /100 | #88 | Exceptional 5.0% |
| Jordanians | 96.4 /100 | #89 | Exceptional 5.0% |
| Immigrants | North Macedonia | 96.3 /100 | #90 | Exceptional 5.0% |
| Immigrants | Sudan | 96.3 /100 | #91 | Exceptional 5.0% |
| Immigrants | South Africa | 96.2 /100 | #92 | Exceptional 5.0% |
| Ukrainians | 96.0 /100 | #93 | Exceptional 5.0% |
| Immigrants | Austria | 95.9 /100 | #94 | Exceptional 5.0% |
| Immigrants | Serbia | 95.6 /100 | #95 | Exceptional 5.0% |
| Immigrants | England | 95.2 /100 | #96 | Exceptional 5.0% |
| Immigrants | Czechoslovakia | 95.1 /100 | #97 | Exceptional 5.0% |
| Romanians | 95.0 /100 | #98 | Exceptional 5.0% |
| Mongolians | 94.8 /100 | #99 | Exceptional 5.0% |
| Estonians | 94.6 /100 | #100 | Exceptional 5.0% |
| Americans | 94.3 /100 | #101 | Exceptional 5.0% |
| Immigrants | Argentina | 94.1 /100 | #102 | Exceptional 5.0% |