Iraqi vs Immigrants from Japan Unemployment Among Women with Children Ages 6 to 17 years
COMPARE
Iraqi
Immigrants from Japan
Unemployment Among Women with Children Ages 6 to 17 years
Unemployment Among Women with Children Ages 6 to 17 years Comparison
Iraqis
Immigrants from Japan
8.4%
UNEMPLOYMENT AMONG WOMEN WITH CHILDREN AGES 6 TO 17 YEARS
99.7/ 100
METRIC RATING
77th/ 347
METRIC RANK
8.2%
UNEMPLOYMENT AMONG WOMEN WITH CHILDREN AGES 6 TO 17 YEARS
100.0/ 100
METRIC RATING
55th/ 347
METRIC RANK
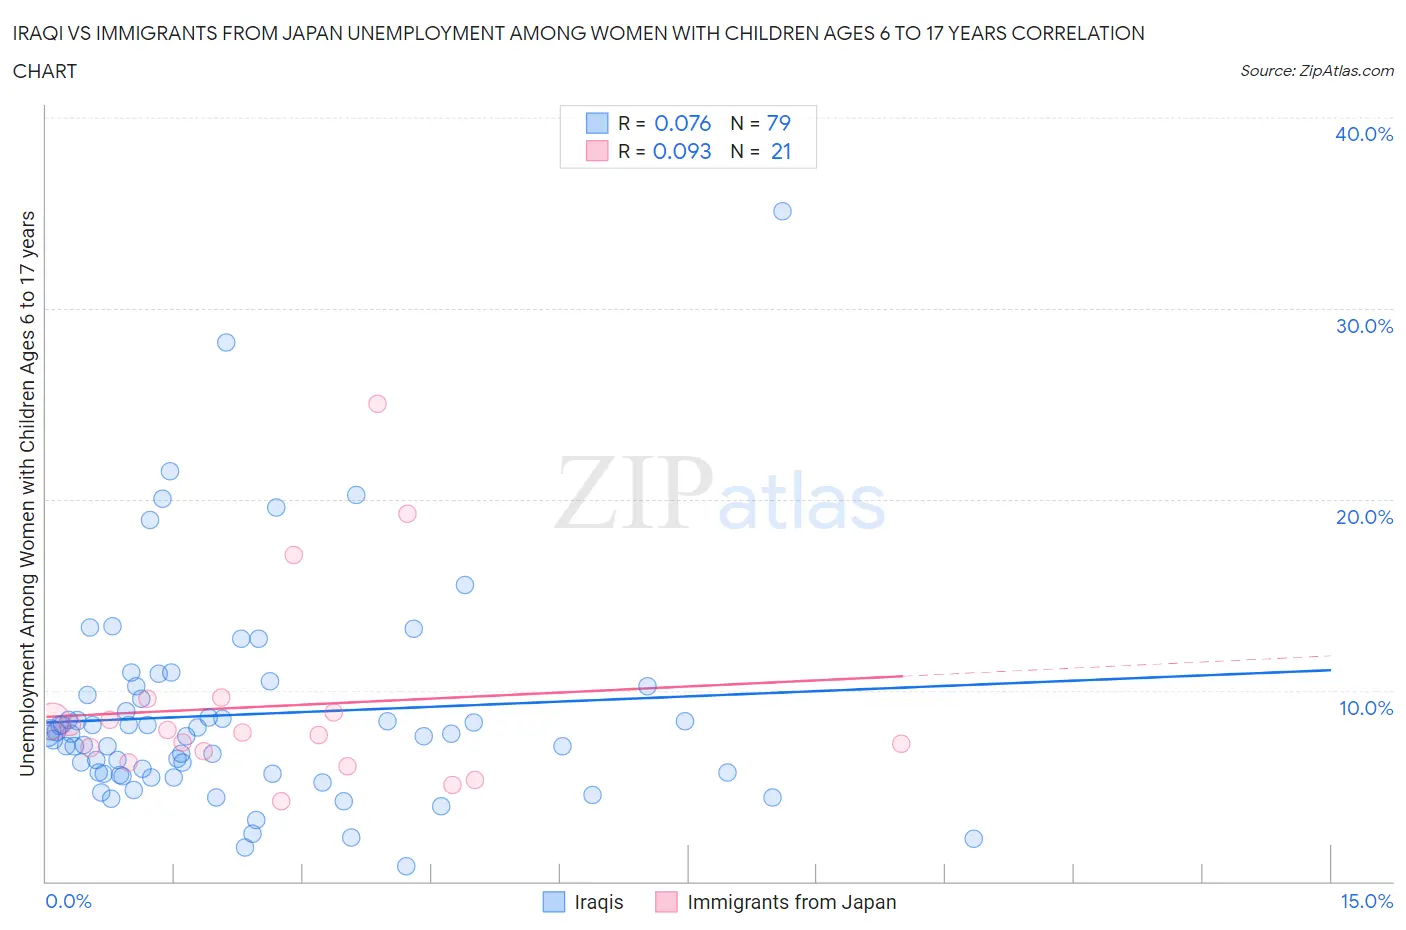
Iraqi vs Immigrants from Japan Unemployment Among Women with Children Ages 6 to 17 years Correlation Chart
The statistical analysis conducted on geographies consisting of 141,144,202 people shows a slight positive correlation between the proportion of Iraqis and unemployment rate among women with children between the ages 6 and 17 in the United States with a correlation coefficient (R) of 0.076 and weighted average of 8.4%. Similarly, the statistical analysis conducted on geographies consisting of 254,422,698 people shows a slight positive correlation between the proportion of Immigrants from Japan and unemployment rate among women with children between the ages 6 and 17 in the United States with a correlation coefficient (R) of 0.093 and weighted average of 8.2%, a difference of 2.9%.
Unemployment Among Women with Children Ages 6 to 17 years Correlation Summary
| Measurement | Iraqi | Immigrants from Japan |
| Minimum | 0.80% | 4.2% |
| Maximum | 35.1% | 25.0% |
| Range | 34.3% | 20.8% |
| Mean | 8.7% | 9.2% |
| Median | 7.6% | 7.8% |
| Interquartile 25% (IQ1) | 5.6% | 6.5% |
| Interquartile 75% (IQ3) | 9.8% | 9.2% |
| Interquartile Range (IQR) | 4.2% | 2.7% |
| Standard Deviation (Sample) | 5.6% | 5.1% |
| Standard Deviation (Population) | 5.6% | 5.0% |
Similar Demographics by Unemployment Among Women with Children Ages 6 to 17 years
Demographics Similar to Iraqis by Unemployment Among Women with Children Ages 6 to 17 years
In terms of unemployment among women with children ages 6 to 17 years, the demographic groups most similar to Iraqis are Immigrants from Moldova (8.4%, a difference of 0.050%), Immigrants from Sri Lanka (8.4%, a difference of 0.080%), Pakistani (8.4%, a difference of 0.14%), Mongolian (8.4%, a difference of 0.15%), and Samoan (8.4%, a difference of 0.16%).
| Demographics | Rating | Rank | Unemployment Among Women with Children Ages 6 to 17 years |
| Norwegians | 99.9 /100 | #70 | Exceptional 8.3% |
| Immigrants | Australia | 99.8 /100 | #71 | Exceptional 8.3% |
| Immigrants | Nepal | 99.8 /100 | #72 | Exceptional 8.3% |
| Spanish Americans | 99.8 /100 | #73 | Exceptional 8.4% |
| Samoans | 99.7 /100 | #74 | Exceptional 8.4% |
| Immigrants | Sri Lanka | 99.7 /100 | #75 | Exceptional 8.4% |
| Immigrants | Moldova | 99.7 /100 | #76 | Exceptional 8.4% |
| Iraqis | 99.7 /100 | #77 | Exceptional 8.4% |
| Pakistanis | 99.6 /100 | #78 | Exceptional 8.4% |
| Mongolians | 99.6 /100 | #79 | Exceptional 8.4% |
| Immigrants | Belarus | 99.6 /100 | #80 | Exceptional 8.4% |
| Immigrants | Bolivia | 99.6 /100 | #81 | Exceptional 8.4% |
| Cypriots | 99.6 /100 | #82 | Exceptional 8.4% |
| Bulgarians | 99.5 /100 | #83 | Exceptional 8.4% |
| Japanese | 99.5 /100 | #84 | Exceptional 8.4% |
Demographics Similar to Immigrants from Japan by Unemployment Among Women with Children Ages 6 to 17 years
In terms of unemployment among women with children ages 6 to 17 years, the demographic groups most similar to Immigrants from Japan are Immigrants from Bosnia and Herzegovina (8.2%, a difference of 0.010%), Immigrants from Laos (8.2%, a difference of 0.030%), Immigrants from Armenia (8.2%, a difference of 0.060%), Immigrants from Malaysia (8.2%, a difference of 0.23%), and Danish (8.1%, a difference of 0.29%).
| Demographics | Rating | Rank | Unemployment Among Women with Children Ages 6 to 17 years |
| Immigrants | Asia | 100.0 /100 | #48 | Exceptional 8.1% |
| Immigrants | Oceania | 100.0 /100 | #49 | Exceptional 8.1% |
| Hawaiians | 100.0 /100 | #50 | Exceptional 8.1% |
| Immigrants | Sudan | 100.0 /100 | #51 | Exceptional 8.1% |
| Immigrants | Iraq | 100.0 /100 | #52 | Exceptional 8.1% |
| Danes | 100.0 /100 | #53 | Exceptional 8.1% |
| Immigrants | Armenia | 100.0 /100 | #54 | Exceptional 8.2% |
| Immigrants | Japan | 100.0 /100 | #55 | Exceptional 8.2% |
| Immigrants | Bosnia and Herzegovina | 100.0 /100 | #56 | Exceptional 8.2% |
| Immigrants | Laos | 100.0 /100 | #57 | Exceptional 8.2% |
| Immigrants | Malaysia | 100.0 /100 | #58 | Exceptional 8.2% |
| Immigrants | Philippines | 100.0 /100 | #59 | Exceptional 8.2% |
| Basques | 100.0 /100 | #60 | Exceptional 8.2% |
| Koreans | 100.0 /100 | #61 | Exceptional 8.2% |
| Spanish American Indians | 100.0 /100 | #62 | Exceptional 8.2% |