Immigrants from Venezuela vs Immigrants from Japan Unemployment Among Women with Children Ages 6 to 17 years
COMPARE
Immigrants from Venezuela
Immigrants from Japan
Unemployment Among Women with Children Ages 6 to 17 years
Unemployment Among Women with Children Ages 6 to 17 years Comparison
Immigrants from Venezuela
Immigrants from Japan
10.2%
UNEMPLOYMENT AMONG WOMEN WITH CHILDREN AGES 6 TO 17 YEARS
0.0/ 100
METRIC RATING
304th/ 347
METRIC RANK
8.2%
UNEMPLOYMENT AMONG WOMEN WITH CHILDREN AGES 6 TO 17 YEARS
100.0/ 100
METRIC RATING
55th/ 347
METRIC RANK
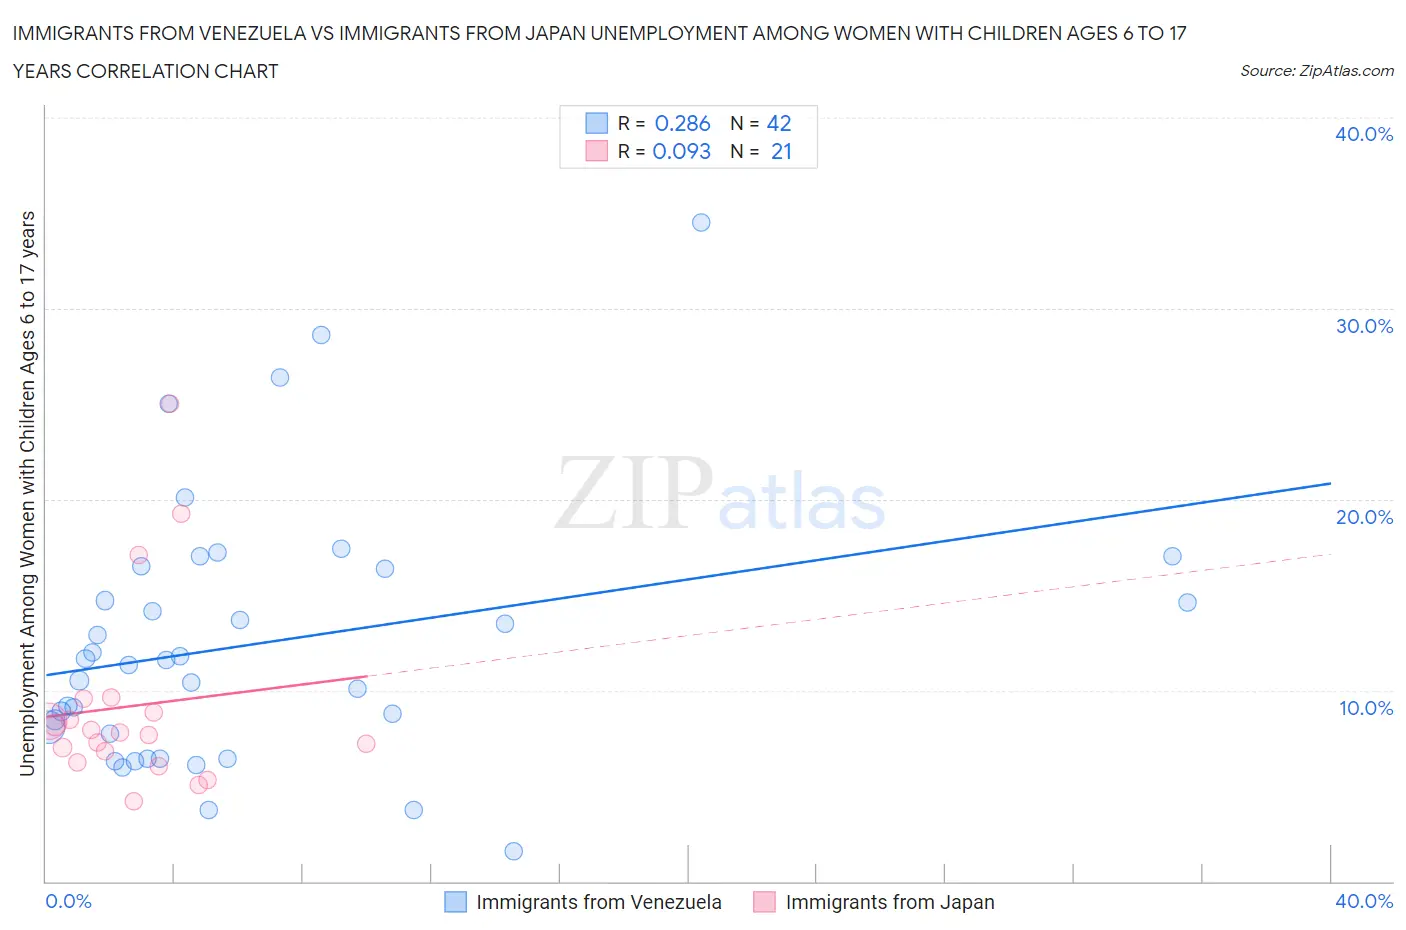
Immigrants from Venezuela vs Immigrants from Japan Unemployment Among Women with Children Ages 6 to 17 years Correlation Chart
The statistical analysis conducted on geographies consisting of 220,713,316 people shows a weak positive correlation between the proportion of Immigrants from Venezuela and unemployment rate among women with children between the ages 6 and 17 in the United States with a correlation coefficient (R) of 0.286 and weighted average of 10.2%. Similarly, the statistical analysis conducted on geographies consisting of 254,422,698 people shows a slight positive correlation between the proportion of Immigrants from Japan and unemployment rate among women with children between the ages 6 and 17 in the United States with a correlation coefficient (R) of 0.093 and weighted average of 8.2%, a difference of 24.8%.
Unemployment Among Women with Children Ages 6 to 17 years Correlation Summary
| Measurement | Immigrants from Venezuela | Immigrants from Japan |
| Minimum | 1.6% | 4.2% |
| Maximum | 34.5% | 25.0% |
| Range | 32.9% | 20.8% |
| Mean | 12.4% | 9.2% |
| Median | 11.4% | 7.8% |
| Interquartile 25% (IQ1) | 7.7% | 6.5% |
| Interquartile 75% (IQ3) | 16.3% | 9.2% |
| Interquartile Range (IQR) | 8.6% | 2.7% |
| Standard Deviation (Sample) | 6.9% | 5.1% |
| Standard Deviation (Population) | 6.8% | 5.0% |
Similar Demographics by Unemployment Among Women with Children Ages 6 to 17 years
Demographics Similar to Immigrants from Venezuela by Unemployment Among Women with Children Ages 6 to 17 years
In terms of unemployment among women with children ages 6 to 17 years, the demographic groups most similar to Immigrants from Venezuela are Immigrants from Nigeria (10.2%, a difference of 0.060%), Immigrants from Ecuador (10.2%, a difference of 0.090%), Venezuelan (10.2%, a difference of 0.27%), Paraguayan (10.2%, a difference of 0.35%), and Immigrants from Senegal (10.2%, a difference of 0.57%).
| Demographics | Rating | Rank | Unemployment Among Women with Children Ages 6 to 17 years |
| Immigrants | Caribbean | 0.0 /100 | #297 | Tragic 10.1% |
| Immigrants | Haiti | 0.0 /100 | #298 | Tragic 10.1% |
| Immigrants | Honduras | 0.0 /100 | #299 | Tragic 10.1% |
| Nigerians | 0.0 /100 | #300 | Tragic 10.1% |
| Immigrants | Bahamas | 0.0 /100 | #301 | Tragic 10.1% |
| Venezuelans | 0.0 /100 | #302 | Tragic 10.2% |
| Immigrants | Ecuador | 0.0 /100 | #303 | Tragic 10.2% |
| Immigrants | Venezuela | 0.0 /100 | #304 | Tragic 10.2% |
| Immigrants | Nigeria | 0.0 /100 | #305 | Tragic 10.2% |
| Paraguayans | 0.0 /100 | #306 | Tragic 10.2% |
| Immigrants | Senegal | 0.0 /100 | #307 | Tragic 10.2% |
| Dutch West Indians | 0.0 /100 | #308 | Tragic 10.2% |
| French Canadians | 0.0 /100 | #309 | Tragic 10.3% |
| Alaska Natives | 0.0 /100 | #310 | Tragic 10.3% |
| Immigrants | Liberia | 0.0 /100 | #311 | Tragic 10.3% |
Demographics Similar to Immigrants from Japan by Unemployment Among Women with Children Ages 6 to 17 years
In terms of unemployment among women with children ages 6 to 17 years, the demographic groups most similar to Immigrants from Japan are Immigrants from Bosnia and Herzegovina (8.2%, a difference of 0.010%), Immigrants from Laos (8.2%, a difference of 0.030%), Immigrants from Armenia (8.2%, a difference of 0.060%), Immigrants from Malaysia (8.2%, a difference of 0.23%), and Danish (8.1%, a difference of 0.29%).
| Demographics | Rating | Rank | Unemployment Among Women with Children Ages 6 to 17 years |
| Immigrants | Asia | 100.0 /100 | #48 | Exceptional 8.1% |
| Immigrants | Oceania | 100.0 /100 | #49 | Exceptional 8.1% |
| Hawaiians | 100.0 /100 | #50 | Exceptional 8.1% |
| Immigrants | Sudan | 100.0 /100 | #51 | Exceptional 8.1% |
| Immigrants | Iraq | 100.0 /100 | #52 | Exceptional 8.1% |
| Danes | 100.0 /100 | #53 | Exceptional 8.1% |
| Immigrants | Armenia | 100.0 /100 | #54 | Exceptional 8.2% |
| Immigrants | Japan | 100.0 /100 | #55 | Exceptional 8.2% |
| Immigrants | Bosnia and Herzegovina | 100.0 /100 | #56 | Exceptional 8.2% |
| Immigrants | Laos | 100.0 /100 | #57 | Exceptional 8.2% |
| Immigrants | Malaysia | 100.0 /100 | #58 | Exceptional 8.2% |
| Immigrants | Philippines | 100.0 /100 | #59 | Exceptional 8.2% |
| Basques | 100.0 /100 | #60 | Exceptional 8.2% |
| Koreans | 100.0 /100 | #61 | Exceptional 8.2% |
| Spanish American Indians | 100.0 /100 | #62 | Exceptional 8.2% |