Iraqi vs Immigrants from Europe Unemployment Among Women with Children Ages 6 to 17 years
COMPARE
Iraqi
Immigrants from Europe
Unemployment Among Women with Children Ages 6 to 17 years
Unemployment Among Women with Children Ages 6 to 17 years Comparison
Iraqis
Immigrants from Europe
8.4%
UNEMPLOYMENT AMONG WOMEN WITH CHILDREN AGES 6 TO 17 YEARS
99.7/ 100
METRIC RATING
77th/ 347
METRIC RANK
8.9%
UNEMPLOYMENT AMONG WOMEN WITH CHILDREN AGES 6 TO 17 YEARS
73.4/ 100
METRIC RATING
153rd/ 347
METRIC RANK
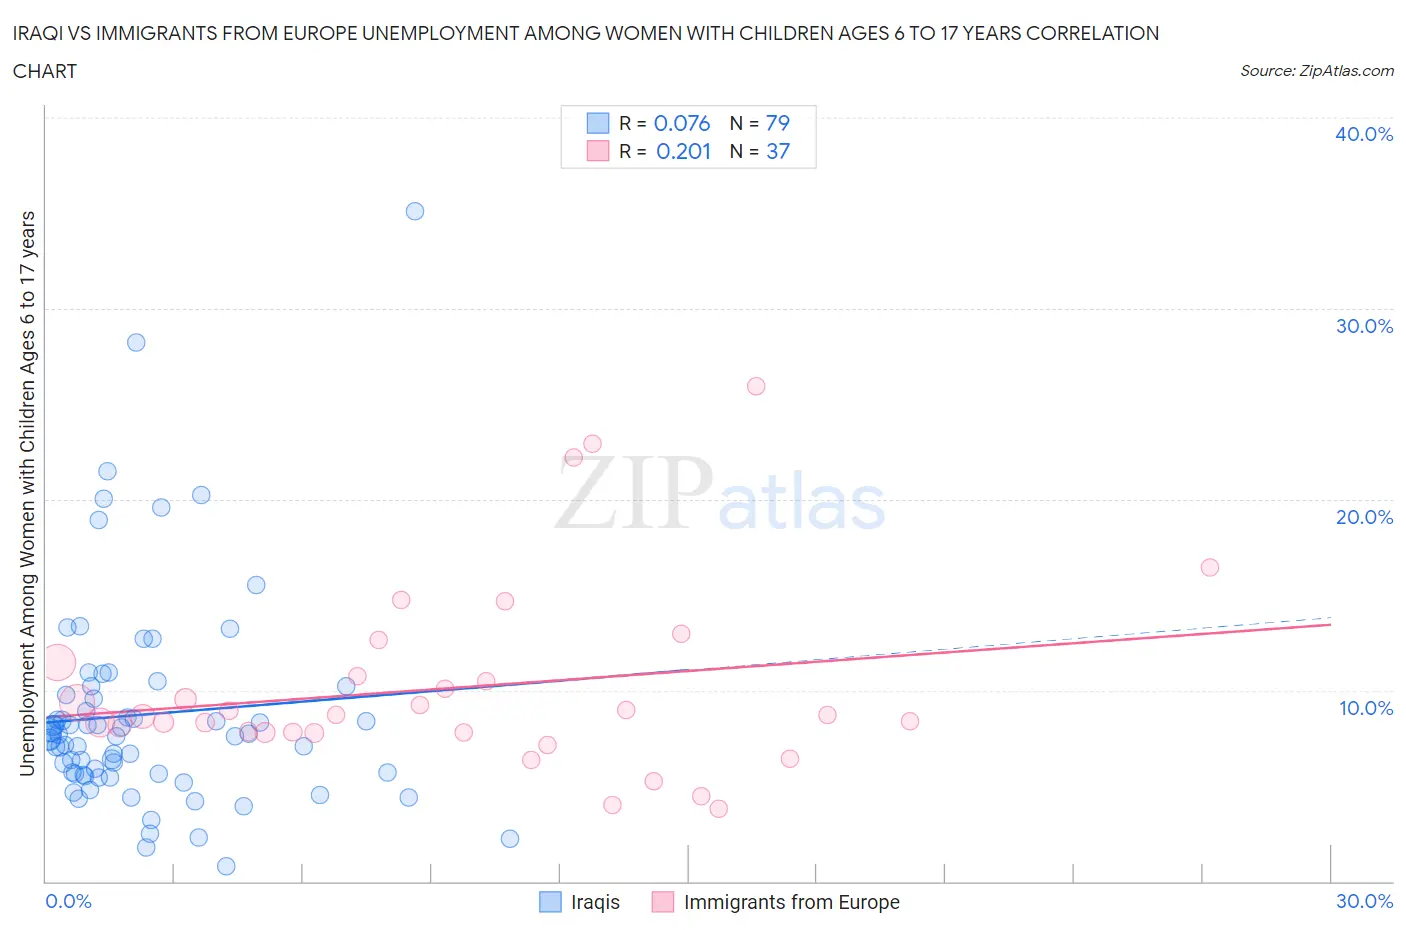
Iraqi vs Immigrants from Europe Unemployment Among Women with Children Ages 6 to 17 years Correlation Chart
The statistical analysis conducted on geographies consisting of 141,144,202 people shows a slight positive correlation between the proportion of Iraqis and unemployment rate among women with children between the ages 6 and 17 in the United States with a correlation coefficient (R) of 0.076 and weighted average of 8.4%. Similarly, the statistical analysis conducted on geographies consisting of 352,744,841 people shows a weak positive correlation between the proportion of Immigrants from Europe and unemployment rate among women with children between the ages 6 and 17 in the United States with a correlation coefficient (R) of 0.201 and weighted average of 8.9%, a difference of 5.6%.
Unemployment Among Women with Children Ages 6 to 17 years Correlation Summary
| Measurement | Iraqi | Immigrants from Europe |
| Minimum | 0.80% | 3.8% |
| Maximum | 35.1% | 25.9% |
| Range | 34.3% | 22.1% |
| Mean | 8.7% | 10.1% |
| Median | 7.6% | 8.7% |
| Interquartile 25% (IQ1) | 5.6% | 7.8% |
| Interquartile 75% (IQ3) | 9.8% | 11.1% |
| Interquartile Range (IQR) | 4.2% | 3.3% |
| Standard Deviation (Sample) | 5.6% | 4.9% |
| Standard Deviation (Population) | 5.6% | 4.9% |
Similar Demographics by Unemployment Among Women with Children Ages 6 to 17 years
Demographics Similar to Iraqis by Unemployment Among Women with Children Ages 6 to 17 years
In terms of unemployment among women with children ages 6 to 17 years, the demographic groups most similar to Iraqis are Immigrants from Moldova (8.4%, a difference of 0.050%), Immigrants from Sri Lanka (8.4%, a difference of 0.080%), Pakistani (8.4%, a difference of 0.14%), Mongolian (8.4%, a difference of 0.15%), and Samoan (8.4%, a difference of 0.16%).
| Demographics | Rating | Rank | Unemployment Among Women with Children Ages 6 to 17 years |
| Norwegians | 99.9 /100 | #70 | Exceptional 8.3% |
| Immigrants | Australia | 99.8 /100 | #71 | Exceptional 8.3% |
| Immigrants | Nepal | 99.8 /100 | #72 | Exceptional 8.3% |
| Spanish Americans | 99.8 /100 | #73 | Exceptional 8.4% |
| Samoans | 99.7 /100 | #74 | Exceptional 8.4% |
| Immigrants | Sri Lanka | 99.7 /100 | #75 | Exceptional 8.4% |
| Immigrants | Moldova | 99.7 /100 | #76 | Exceptional 8.4% |
| Iraqis | 99.7 /100 | #77 | Exceptional 8.4% |
| Pakistanis | 99.6 /100 | #78 | Exceptional 8.4% |
| Mongolians | 99.6 /100 | #79 | Exceptional 8.4% |
| Immigrants | Belarus | 99.6 /100 | #80 | Exceptional 8.4% |
| Immigrants | Bolivia | 99.6 /100 | #81 | Exceptional 8.4% |
| Cypriots | 99.6 /100 | #82 | Exceptional 8.4% |
| Bulgarians | 99.5 /100 | #83 | Exceptional 8.4% |
| Japanese | 99.5 /100 | #84 | Exceptional 8.4% |
Demographics Similar to Immigrants from Europe by Unemployment Among Women with Children Ages 6 to 17 years
In terms of unemployment among women with children ages 6 to 17 years, the demographic groups most similar to Immigrants from Europe are Immigrants from Eastern Africa (8.9%, a difference of 0.070%), Immigrants from Northern Europe (8.9%, a difference of 0.070%), Vietnamese (8.9%, a difference of 0.070%), Immigrants from Greece (8.9%, a difference of 0.090%), and Greek (8.9%, a difference of 0.11%).
| Demographics | Rating | Rank | Unemployment Among Women with Children Ages 6 to 17 years |
| Chileans | 80.8 /100 | #146 | Excellent 8.8% |
| Immigrants | Bangladesh | 79.4 /100 | #147 | Good 8.8% |
| Costa Ricans | 77.0 /100 | #148 | Good 8.8% |
| Croatians | 76.0 /100 | #149 | Good 8.8% |
| Greeks | 75.2 /100 | #150 | Good 8.9% |
| Immigrants | Eastern Africa | 74.6 /100 | #151 | Good 8.9% |
| Immigrants | Northern Europe | 74.6 /100 | #152 | Good 8.9% |
| Immigrants | Europe | 73.4 /100 | #153 | Good 8.9% |
| Vietnamese | 72.1 /100 | #154 | Good 8.9% |
| Immigrants | Greece | 71.8 /100 | #155 | Good 8.9% |
| Osage | 65.9 /100 | #156 | Good 8.9% |
| Immigrants | Belgium | 65.6 /100 | #157 | Good 8.9% |
| Immigrants | Chile | 65.3 /100 | #158 | Good 8.9% |
| Spanish | 63.8 /100 | #159 | Good 8.9% |
| Immigrants | Hungary | 63.4 /100 | #160 | Good 8.9% |