Immigrants from Kuwait vs Immigrants from Latvia Unemployment
COMPARE
Immigrants from Kuwait
Immigrants from Latvia
Unemployment
Unemployment Comparison
Immigrants from Kuwait
Immigrants from Latvia
5.0%
UNEMPLOYMENT
93.7/ 100
METRIC RATING
108th/ 347
METRIC RANK
5.1%
UNEMPLOYMENT
88.0/ 100
METRIC RATING
129th/ 347
METRIC RANK
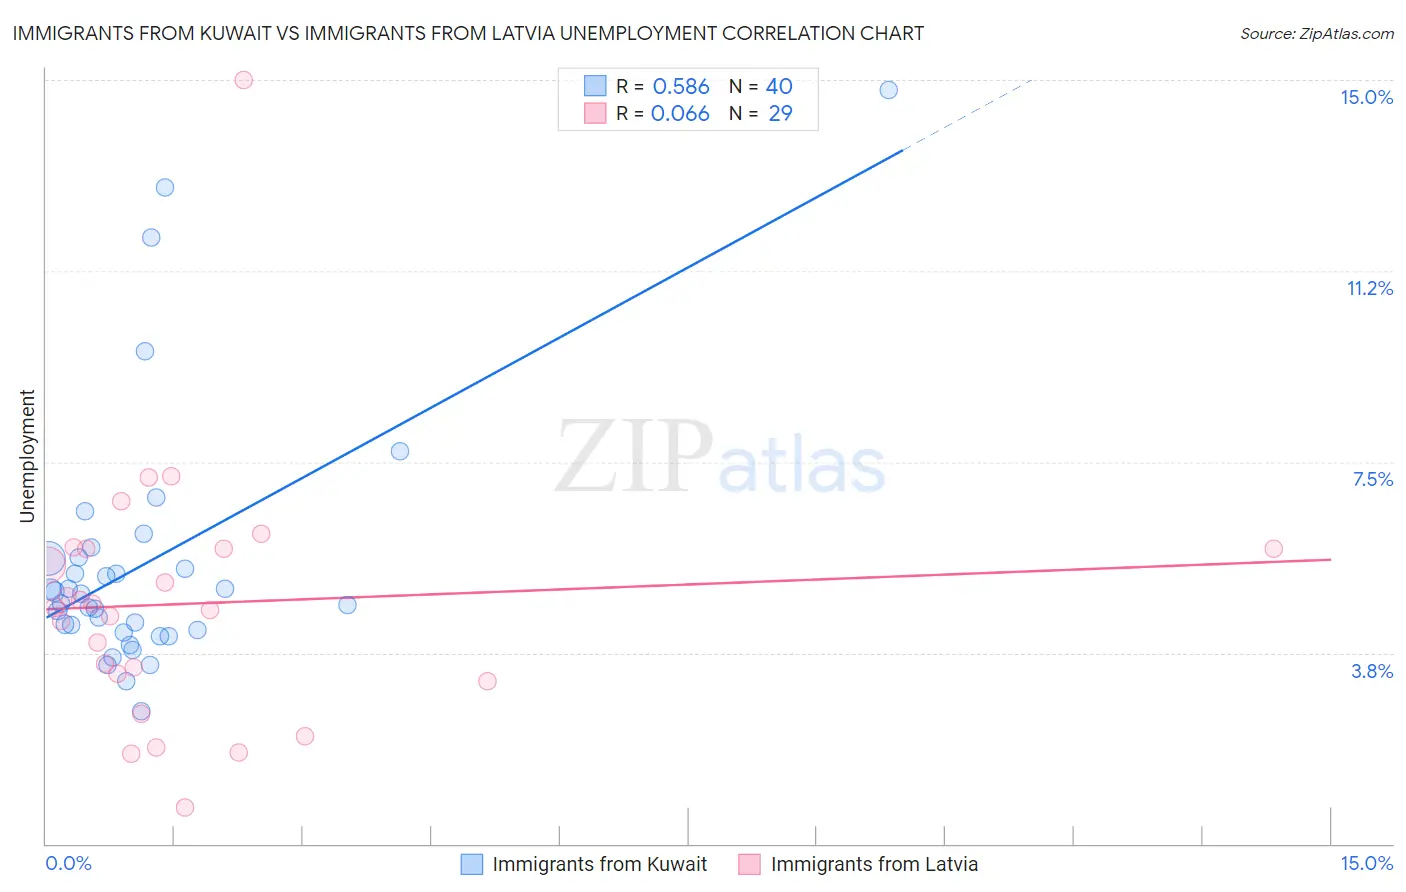
Immigrants from Kuwait vs Immigrants from Latvia Unemployment Correlation Chart
The statistical analysis conducted on geographies consisting of 136,907,851 people shows a substantial positive correlation between the proportion of Immigrants from Kuwait and unemployment in the United States with a correlation coefficient (R) of 0.586 and weighted average of 5.0%. Similarly, the statistical analysis conducted on geographies consisting of 113,721,061 people shows a slight positive correlation between the proportion of Immigrants from Latvia and unemployment in the United States with a correlation coefficient (R) of 0.066 and weighted average of 5.1%, a difference of 1.1%.
Unemployment Correlation Summary
| Measurement | Immigrants from Kuwait | Immigrants from Latvia |
| Minimum | 2.6% | 0.70% |
| Maximum | 14.8% | 15.0% |
| Range | 12.2% | 14.3% |
| Mean | 5.5% | 4.7% |
| Median | 4.8% | 4.6% |
| Interquartile 25% (IQ1) | 4.2% | 3.3% |
| Interquartile 75% (IQ3) | 5.6% | 5.8% |
| Interquartile Range (IQR) | 1.4% | 2.5% |
| Standard Deviation (Sample) | 2.6% | 2.6% |
| Standard Deviation (Population) | 2.5% | 2.6% |
Similar Demographics by Unemployment
Demographics Similar to Immigrants from Kuwait by Unemployment
In terms of unemployment, the demographic groups most similar to Immigrants from Kuwait are Immigrants from Turkey (5.0%, a difference of 0.010%), Immigrants from Romania (5.0%, a difference of 0.020%), Chickasaw (5.0%, a difference of 0.080%), Osage (5.0%, a difference of 0.080%), and Maltese (5.0%, a difference of 0.080%).
| Demographics | Rating | Rank | Unemployment |
| Americans | 94.3 /100 | #101 | Exceptional 5.0% |
| Immigrants | Argentina | 94.1 /100 | #102 | Exceptional 5.0% |
| Chickasaw | 94.0 /100 | #103 | Exceptional 5.0% |
| Osage | 94.0 /100 | #104 | Exceptional 5.0% |
| Maltese | 94.0 /100 | #105 | Exceptional 5.0% |
| Immigrants | Romania | 93.7 /100 | #106 | Exceptional 5.0% |
| Immigrants | Turkey | 93.7 /100 | #107 | Exceptional 5.0% |
| Immigrants | Kuwait | 93.7 /100 | #108 | Exceptional 5.0% |
| Immigrants | Eritrea | 93.3 /100 | #109 | Exceptional 5.0% |
| Immigrants | Lithuania | 93.2 /100 | #110 | Exceptional 5.0% |
| Chileans | 93.2 /100 | #111 | Exceptional 5.0% |
| South Africans | 92.6 /100 | #112 | Exceptional 5.1% |
| Argentineans | 92.4 /100 | #113 | Exceptional 5.1% |
| Immigrants | Ireland | 92.1 /100 | #114 | Exceptional 5.1% |
| Immigrants | Western Europe | 91.1 /100 | #115 | Exceptional 5.1% |
Demographics Similar to Immigrants from Latvia by Unemployment
In terms of unemployment, the demographic groups most similar to Immigrants from Latvia are Immigrants from Eastern Africa (5.1%, a difference of 0.0%), Kenyan (5.1%, a difference of 0.020%), Immigrants from Kenya (5.1%, a difference of 0.020%), Immigrants from Eastern Asia (5.1%, a difference of 0.040%), and Ethiopian (5.1%, a difference of 0.090%).
| Demographics | Rating | Rank | Unemployment |
| Immigrants | Switzerland | 89.1 /100 | #122 | Excellent 5.1% |
| Asians | 89.0 /100 | #123 | Excellent 5.1% |
| Ethiopians | 88.6 /100 | #124 | Excellent 5.1% |
| Immigrants | Eastern Asia | 88.3 /100 | #125 | Excellent 5.1% |
| Kenyans | 88.2 /100 | #126 | Excellent 5.1% |
| Immigrants | Kenya | 88.2 /100 | #127 | Excellent 5.1% |
| Immigrants | Eastern Africa | 88.1 /100 | #128 | Excellent 5.1% |
| Immigrants | Latvia | 88.0 /100 | #129 | Excellent 5.1% |
| Iranians | 86.9 /100 | #130 | Excellent 5.1% |
| Immigrants | Croatia | 86.8 /100 | #131 | Excellent 5.1% |
| Immigrants | Ethiopia | 86.7 /100 | #132 | Excellent 5.1% |
| Immigrants | Jordan | 86.6 /100 | #133 | Excellent 5.1% |
| Immigrants | Europe | 86.3 /100 | #134 | Excellent 5.1% |
| Immigrants | Burma/Myanmar | 86.2 /100 | #135 | Excellent 5.1% |
| Immigrants | Spain | 86.2 /100 | #136 | Excellent 5.1% |