Immigrants from Western Europe vs Ethiopian Unemployment Among Women with Children Ages 6 to 17 years
COMPARE
Immigrants from Western Europe
Ethiopian
Unemployment Among Women with Children Ages 6 to 17 years
Unemployment Among Women with Children Ages 6 to 17 years Comparison
Immigrants from Western Europe
Ethiopians
9.1%
UNEMPLOYMENT AMONG WOMEN WITH CHILDREN AGES 6 TO 17 YEARS
14.1/ 100
METRIC RATING
205th/ 347
METRIC RANK
9.0%
UNEMPLOYMENT AMONG WOMEN WITH CHILDREN AGES 6 TO 17 YEARS
37.6/ 100
METRIC RATING
180th/ 347
METRIC RANK
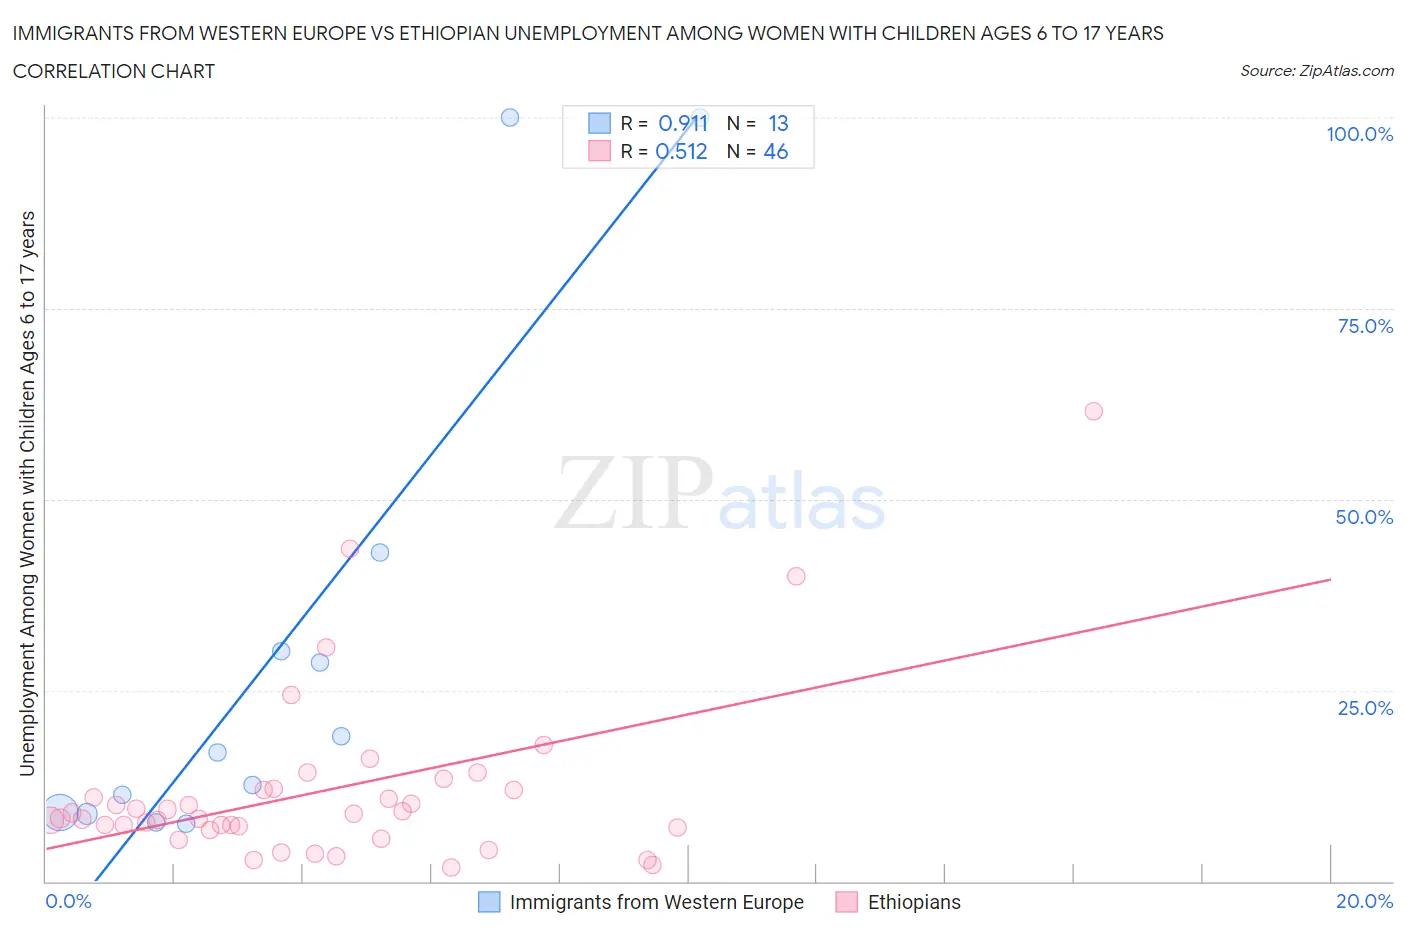
Immigrants from Western Europe vs Ethiopian Unemployment Among Women with Children Ages 6 to 17 years Correlation Chart
The statistical analysis conducted on geographies consisting of 331,705,739 people shows a near-perfect positive correlation between the proportion of Immigrants from Western Europe and unemployment rate among women with children between the ages 6 and 17 in the United States with a correlation coefficient (R) of 0.911 and weighted average of 9.1%. Similarly, the statistical analysis conducted on geographies consisting of 181,219,006 people shows a substantial positive correlation between the proportion of Ethiopians and unemployment rate among women with children between the ages 6 and 17 in the United States with a correlation coefficient (R) of 0.512 and weighted average of 9.0%, a difference of 1.4%.
Unemployment Among Women with Children Ages 6 to 17 years Correlation Summary
| Measurement | Immigrants from Western Europe | Ethiopian |
| Minimum | 7.5% | 1.8% |
| Maximum | 100.0% | 61.5% |
| Range | 92.5% | 59.7% |
| Mean | 30.4% | 11.8% |
| Median | 16.8% | 8.6% |
| Interquartile 25% (IQ1) | 8.9% | 7.1% |
| Interquartile 75% (IQ3) | 36.5% | 12.0% |
| Interquartile Range (IQR) | 27.6% | 4.9% |
| Standard Deviation (Sample) | 32.7% | 11.4% |
| Standard Deviation (Population) | 31.4% | 11.2% |
Similar Demographics by Unemployment Among Women with Children Ages 6 to 17 years
Demographics Similar to Immigrants from Western Europe by Unemployment Among Women with Children Ages 6 to 17 years
In terms of unemployment among women with children ages 6 to 17 years, the demographic groups most similar to Immigrants from Western Europe are Immigrants from Canada (9.1%, a difference of 0.10%), Maltese (9.1%, a difference of 0.11%), Immigrants from Middle Africa (9.1%, a difference of 0.13%), Immigrants from North America (9.2%, a difference of 0.13%), and Immigrants from Trinidad and Tobago (9.1%, a difference of 0.22%).
| Demographics | Rating | Rank | Unemployment Among Women with Children Ages 6 to 17 years |
| Guyanese | 21.8 /100 | #198 | Fair 9.1% |
| Czechoslovakians | 20.8 /100 | #199 | Fair 9.1% |
| Trinidadians and Tobagonians | 18.2 /100 | #200 | Poor 9.1% |
| Immigrants | Trinidad and Tobago | 16.7 /100 | #201 | Poor 9.1% |
| Immigrants | Middle Africa | 15.6 /100 | #202 | Poor 9.1% |
| Maltese | 15.3 /100 | #203 | Poor 9.1% |
| Immigrants | Canada | 15.3 /100 | #204 | Poor 9.1% |
| Immigrants | Western Europe | 14.1 /100 | #205 | Poor 9.1% |
| Immigrants | North America | 12.7 /100 | #206 | Poor 9.2% |
| Cubans | 10.9 /100 | #207 | Poor 9.2% |
| Immigrants | Peru | 10.8 /100 | #208 | Poor 9.2% |
| Salvadorans | 10.7 /100 | #209 | Poor 9.2% |
| Finns | 10.0 /100 | #210 | Tragic 9.2% |
| Immigrants | Cuba | 9.6 /100 | #211 | Tragic 9.2% |
| Peruvians | 9.0 /100 | #212 | Tragic 9.2% |
Demographics Similar to Ethiopians by Unemployment Among Women with Children Ages 6 to 17 years
In terms of unemployment among women with children ages 6 to 17 years, the demographic groups most similar to Ethiopians are Immigrants from Zaire (9.0%, a difference of 0.030%), Menominee (9.0%, a difference of 0.080%), Immigrants from Czechoslovakia (9.0%, a difference of 0.15%), South American Indian (9.0%, a difference of 0.16%), and Immigrants from Jordan (9.0%, a difference of 0.18%).
| Demographics | Rating | Rank | Unemployment Among Women with Children Ages 6 to 17 years |
| Immigrants | Brazil | 51.0 /100 | #173 | Average 9.0% |
| Immigrants | Costa Rica | 50.0 /100 | #174 | Average 9.0% |
| Immigrants | Sierra Leone | 45.9 /100 | #175 | Average 9.0% |
| Immigrants | Italy | 43.7 /100 | #176 | Average 9.0% |
| Immigrants | Jordan | 41.6 /100 | #177 | Average 9.0% |
| Menominee | 39.3 /100 | #178 | Fair 9.0% |
| Immigrants | Zaire | 38.3 /100 | #179 | Fair 9.0% |
| Ethiopians | 37.6 /100 | #180 | Fair 9.0% |
| Immigrants | Czechoslovakia | 34.5 /100 | #181 | Fair 9.0% |
| South American Indians | 34.4 /100 | #182 | Fair 9.0% |
| Swiss | 33.5 /100 | #183 | Fair 9.0% |
| Palestinians | 33.4 /100 | #184 | Fair 9.0% |
| Immigrants | Congo | 32.5 /100 | #185 | Fair 9.0% |
| Immigrants | Spain | 32.4 /100 | #186 | Fair 9.0% |
| Comanche | 30.0 /100 | #187 | Fair 9.0% |