Immigrants from Netherlands vs Colville Female Unemployment
COMPARE
Immigrants from Netherlands
Colville
Female Unemployment
Female Unemployment Comparison
Immigrants from Netherlands
Colville
5.0%
FEMALE UNEMPLOYMENT
97.8/ 100
METRIC RATING
78th/ 347
METRIC RANK
6.0%
FEMALE UNEMPLOYMENT
0.0/ 100
METRIC RATING
282nd/ 347
METRIC RANK
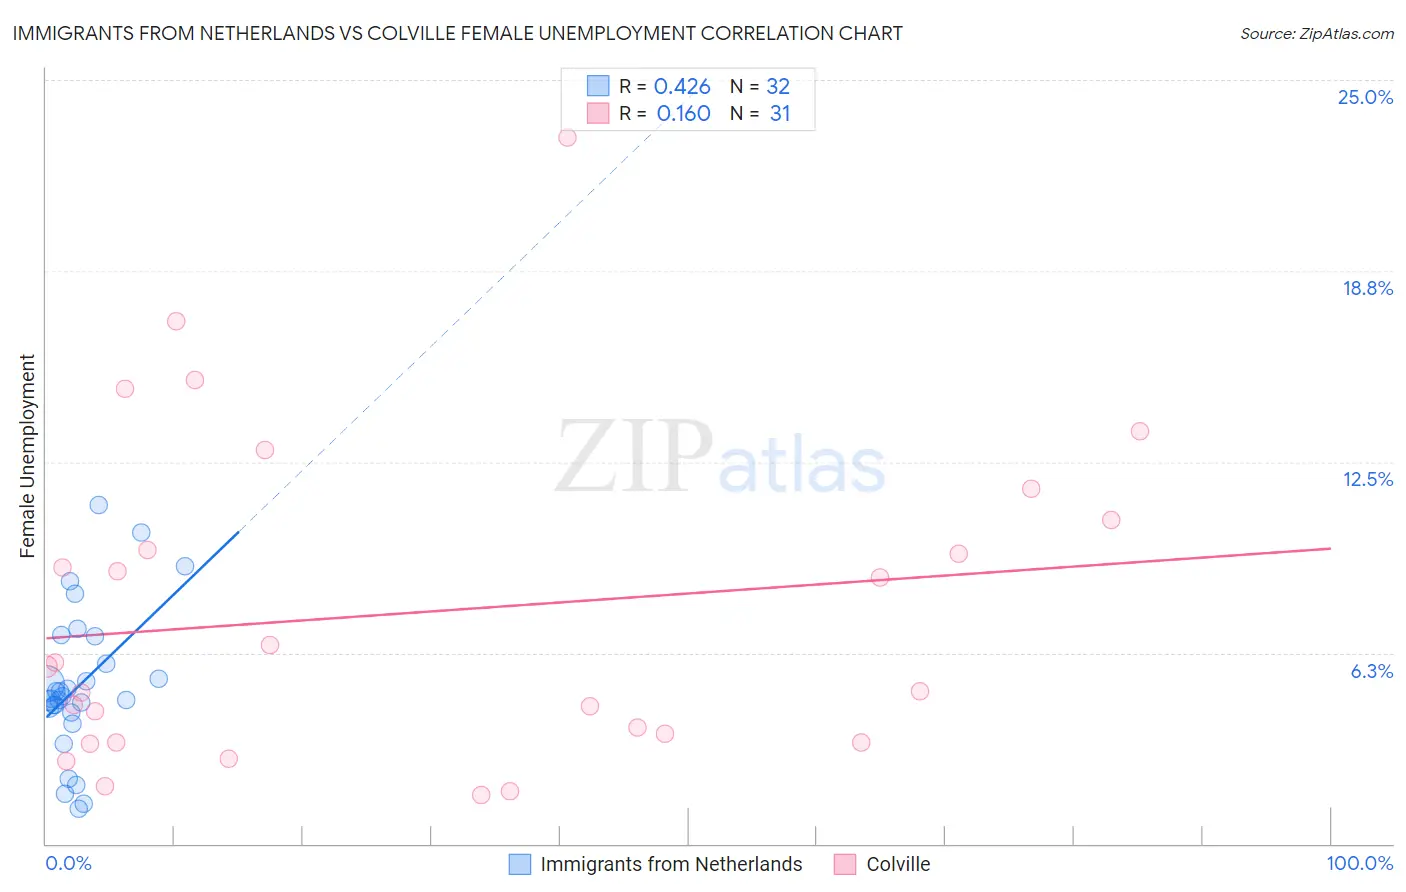
Immigrants from Netherlands vs Colville Female Unemployment Correlation Chart
The statistical analysis conducted on geographies consisting of 237,125,714 people shows a moderate positive correlation between the proportion of Immigrants from Netherlands and unemploymnet rate among females in the United States with a correlation coefficient (R) of 0.426 and weighted average of 5.0%. Similarly, the statistical analysis conducted on geographies consisting of 34,651,422 people shows a poor positive correlation between the proportion of Colville and unemploymnet rate among females in the United States with a correlation coefficient (R) of 0.160 and weighted average of 6.0%, a difference of 21.7%.
Female Unemployment Correlation Summary
| Measurement | Immigrants from Netherlands | Colville |
| Minimum | 1.2% | 1.6% |
| Maximum | 11.1% | 23.1% |
| Range | 9.9% | 21.5% |
| Mean | 5.2% | 7.6% |
| Median | 4.8% | 5.8% |
| Interquartile 25% (IQ1) | 4.4% | 3.3% |
| Interquartile 75% (IQ3) | 6.4% | 10.6% |
| Interquartile Range (IQR) | 2.0% | 7.3% |
| Standard Deviation (Sample) | 2.4% | 5.3% |
| Standard Deviation (Population) | 2.4% | 5.2% |
Similar Demographics by Female Unemployment
Demographics Similar to Immigrants from Netherlands by Female Unemployment
In terms of female unemployment, the demographic groups most similar to Immigrants from Netherlands are Mongolian (5.0%, a difference of 0.0%), Immigrants from Venezuela (5.0%, a difference of 0.090%), Immigrants from Singapore (5.0%, a difference of 0.10%), Immigrants from Bolivia (5.0%, a difference of 0.12%), and Russian (5.0%, a difference of 0.13%).
| Demographics | Rating | Rank | Female Unemployment |
| German Russians | 98.1 /100 | #71 | Exceptional 4.9% |
| Immigrants | Northern Europe | 98.0 /100 | #72 | Exceptional 4.9% |
| Russians | 98.0 /100 | #73 | Exceptional 5.0% |
| Immigrants | Bolivia | 98.0 /100 | #74 | Exceptional 5.0% |
| Immigrants | Singapore | 98.0 /100 | #75 | Exceptional 5.0% |
| Immigrants | Venezuela | 97.9 /100 | #76 | Exceptional 5.0% |
| Mongolians | 97.8 /100 | #77 | Exceptional 5.0% |
| Immigrants | Netherlands | 97.8 /100 | #78 | Exceptional 5.0% |
| Turks | 97.6 /100 | #79 | Exceptional 5.0% |
| New Zealanders | 97.4 /100 | #80 | Exceptional 5.0% |
| Filipinos | 97.3 /100 | #81 | Exceptional 5.0% |
| Immigrants | Australia | 97.3 /100 | #82 | Exceptional 5.0% |
| Immigrants | Serbia | 97.2 /100 | #83 | Exceptional 5.0% |
| Canadians | 97.2 /100 | #84 | Exceptional 5.0% |
| Ukrainians | 97.1 /100 | #85 | Exceptional 5.0% |
Demographics Similar to Colville by Female Unemployment
In terms of female unemployment, the demographic groups most similar to Colville are Salvadoran (6.0%, a difference of 0.10%), Guatemalan (6.0%, a difference of 0.27%), Mexican American Indian (6.0%, a difference of 0.31%), Armenian (6.0%, a difference of 0.37%), and Immigrants from Senegal (6.1%, a difference of 0.44%).
| Demographics | Rating | Rank | Female Unemployment |
| Senegalese | 0.0 /100 | #275 | Tragic 6.0% |
| Bahamians | 0.0 /100 | #276 | Tragic 6.0% |
| Immigrants | Ghana | 0.0 /100 | #277 | Tragic 6.0% |
| Yaqui | 0.0 /100 | #278 | Tragic 6.0% |
| Armenians | 0.0 /100 | #279 | Tragic 6.0% |
| Mexican American Indians | 0.0 /100 | #280 | Tragic 6.0% |
| Guatemalans | 0.0 /100 | #281 | Tragic 6.0% |
| Colville | 0.0 /100 | #282 | Tragic 6.0% |
| Salvadorans | 0.0 /100 | #283 | Tragic 6.0% |
| Immigrants | Senegal | 0.0 /100 | #284 | Tragic 6.1% |
| Immigrants | Cabo Verde | 0.0 /100 | #285 | Tragic 6.1% |
| Chippewa | 0.0 /100 | #286 | Tragic 6.1% |
| Immigrants | Guatemala | 0.0 /100 | #287 | Tragic 6.1% |
| Haitians | 0.0 /100 | #288 | Tragic 6.1% |
| Trinidadians and Tobagonians | 0.0 /100 | #289 | Tragic 6.1% |