Immigrants from Zimbabwe vs Immigrants from Greece Female Unemployment
COMPARE
Immigrants from Zimbabwe
Immigrants from Greece
Female Unemployment
Female Unemployment Comparison
Immigrants from Zimbabwe
Immigrants from Greece
4.9%
FEMALE UNEMPLOYMENT
99.0/ 100
METRIC RATING
54th/ 347
METRIC RANK
5.2%
FEMALE UNEMPLOYMENT
74.9/ 100
METRIC RATING
153rd/ 347
METRIC RANK
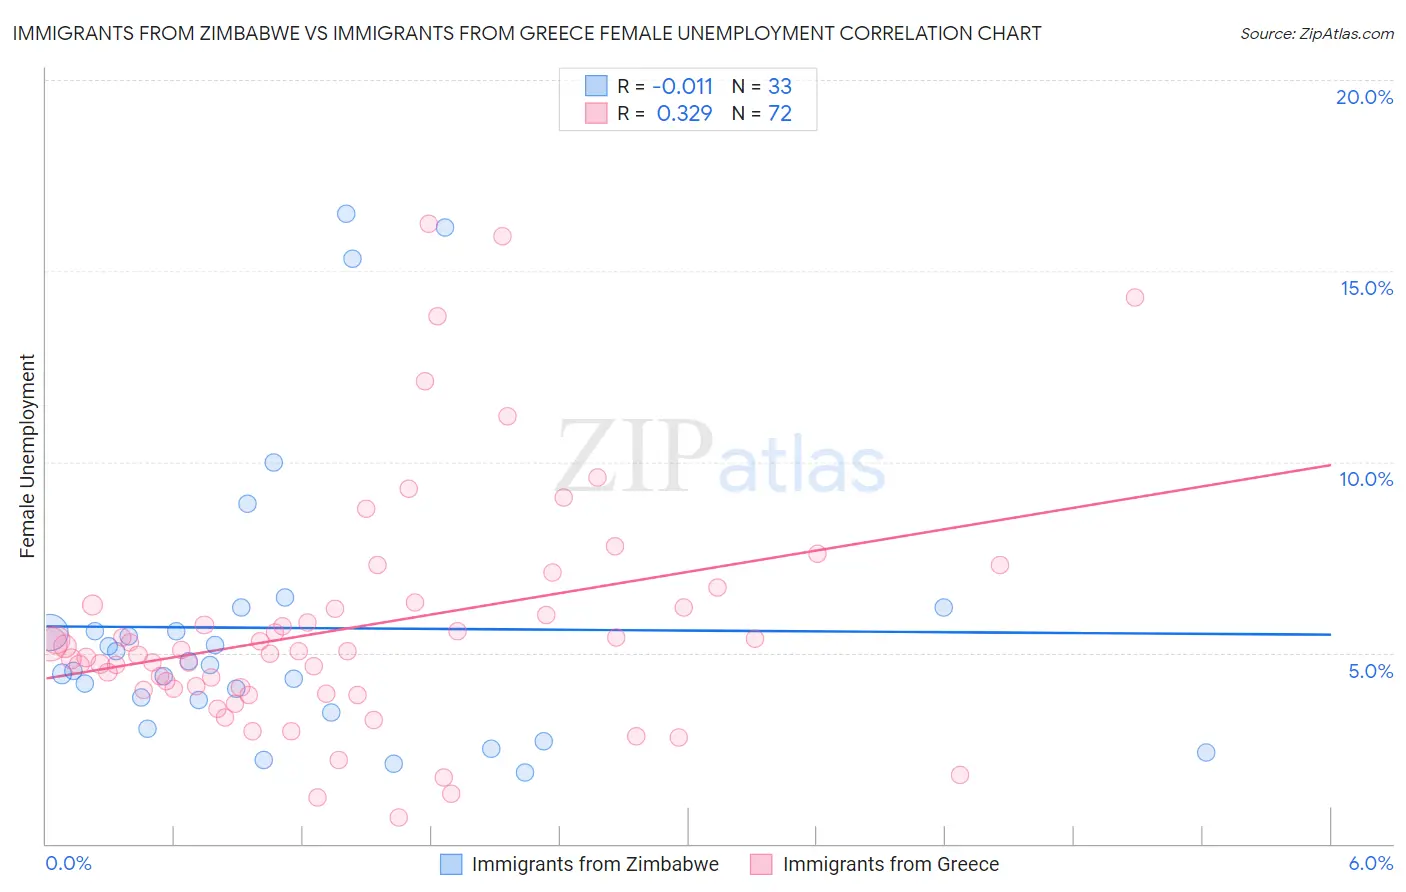
Immigrants from Zimbabwe vs Immigrants from Greece Female Unemployment Correlation Chart
The statistical analysis conducted on geographies consisting of 117,690,630 people shows no correlation between the proportion of Immigrants from Zimbabwe and unemploymnet rate among females in the United States with a correlation coefficient (R) of -0.011 and weighted average of 4.9%. Similarly, the statistical analysis conducted on geographies consisting of 216,457,402 people shows a mild positive correlation between the proportion of Immigrants from Greece and unemploymnet rate among females in the United States with a correlation coefficient (R) of 0.329 and weighted average of 5.2%, a difference of 5.7%.
Female Unemployment Correlation Summary
| Measurement | Immigrants from Zimbabwe | Immigrants from Greece |
| Minimum | 1.9% | 0.70% |
| Maximum | 16.5% | 16.2% |
| Range | 14.6% | 15.5% |
| Mean | 5.7% | 5.7% |
| Median | 4.7% | 5.0% |
| Interquartile 25% (IQ1) | 3.6% | 4.0% |
| Interquartile 75% (IQ3) | 5.9% | 6.2% |
| Interquartile Range (IQR) | 2.3% | 2.2% |
| Standard Deviation (Sample) | 3.8% | 3.1% |
| Standard Deviation (Population) | 3.7% | 3.1% |
Similar Demographics by Female Unemployment
Demographics Similar to Immigrants from Zimbabwe by Female Unemployment
In terms of female unemployment, the demographic groups most similar to Immigrants from Zimbabwe are Immigrants from Moldova (4.9%, a difference of 0.020%), Serbian (4.9%, a difference of 0.030%), White/Caucasian (4.9%, a difference of 0.060%), Slavic (4.9%, a difference of 0.090%), and Cambodian (4.9%, a difference of 0.11%).
| Demographics | Rating | Rank | Female Unemployment |
| Okinawans | 99.3 /100 | #47 | Exceptional 4.9% |
| Thais | 99.2 /100 | #48 | Exceptional 4.9% |
| Australians | 99.2 /100 | #49 | Exceptional 4.9% |
| Immigrants | Cuba | 99.1 /100 | #50 | Exceptional 4.9% |
| Cambodians | 99.1 /100 | #51 | Exceptional 4.9% |
| Slavs | 99.1 /100 | #52 | Exceptional 4.9% |
| Whites/Caucasians | 99.0 /100 | #53 | Exceptional 4.9% |
| Immigrants | Zimbabwe | 99.0 /100 | #54 | Exceptional 4.9% |
| Immigrants | Moldova | 99.0 /100 | #55 | Exceptional 4.9% |
| Serbians | 99.0 /100 | #56 | Exceptional 4.9% |
| Icelanders | 98.8 /100 | #57 | Exceptional 4.9% |
| Immigrants | Lithuania | 98.8 /100 | #58 | Exceptional 4.9% |
| Bhutanese | 98.7 /100 | #59 | Exceptional 4.9% |
| Immigrants | Scotland | 98.6 /100 | #60 | Exceptional 4.9% |
| Immigrants | Canada | 98.6 /100 | #61 | Exceptional 4.9% |
Demographics Similar to Immigrants from Greece by Female Unemployment
In terms of female unemployment, the demographic groups most similar to Immigrants from Greece are Immigrants from Italy (5.2%, a difference of 0.010%), Immigrants from China (5.2%, a difference of 0.080%), Egyptian (5.2%, a difference of 0.29%), Asian (5.2%, a difference of 0.30%), and South African (5.2%, a difference of 0.32%).
| Demographics | Rating | Rank | Female Unemployment |
| Immigrants | Norway | 79.4 /100 | #146 | Good 5.2% |
| Argentineans | 79.2 /100 | #147 | Good 5.2% |
| Immigrants | Argentina | 78.7 /100 | #148 | Good 5.2% |
| Asians | 78.3 /100 | #149 | Good 5.2% |
| Egyptians | 78.3 /100 | #150 | Good 5.2% |
| Immigrants | China | 75.9 /100 | #151 | Good 5.2% |
| Immigrants | Italy | 75.0 /100 | #152 | Good 5.2% |
| Immigrants | Greece | 74.9 /100 | #153 | Good 5.2% |
| South Africans | 70.8 /100 | #154 | Good 5.2% |
| Immigrants | Egypt | 70.0 /100 | #155 | Good 5.2% |
| Immigrants | Northern Africa | 69.6 /100 | #156 | Good 5.2% |
| Immigrants | Russia | 69.3 /100 | #157 | Good 5.2% |
| Albanians | 68.3 /100 | #158 | Good 5.2% |
| Immigrants | Micronesia | 66.9 /100 | #159 | Good 5.2% |
| Immigrants | Spain | 66.8 /100 | #160 | Good 5.2% |