Polish vs Greek Male Unemployment
COMPARE
Polish
Greek
Male Unemployment
Male Unemployment Comparison
Poles
Greeks
4.9%
MALE UNEMPLOYMENT
98.9/ 100
METRIC RATING
49th/ 347
METRIC RANK
5.0%
MALE UNEMPLOYMENT
97.0/ 100
METRIC RATING
73rd/ 347
METRIC RANK
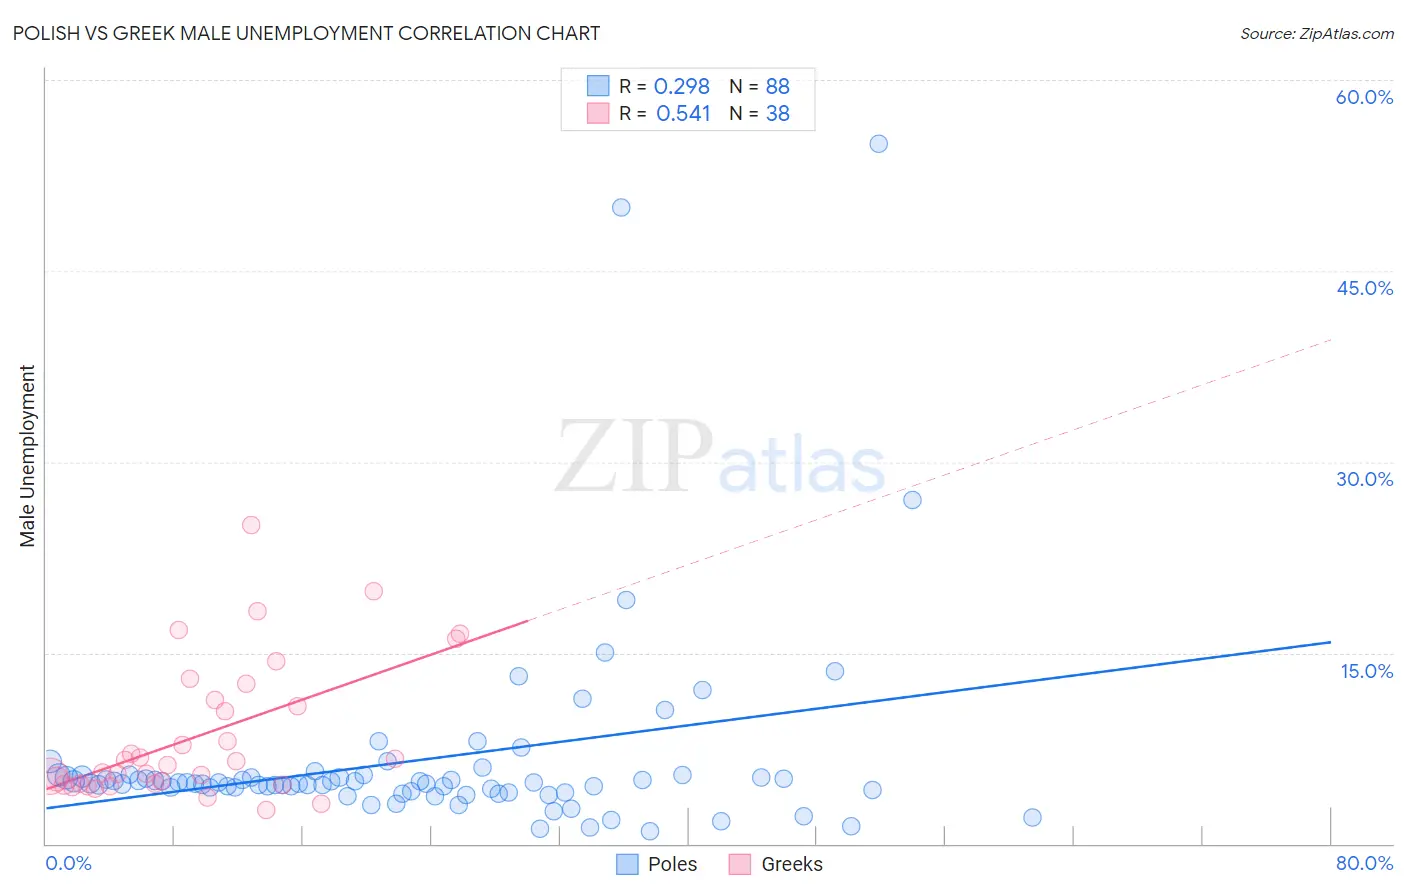
Polish vs Greek Male Unemployment Correlation Chart
The statistical analysis conducted on geographies consisting of 550,894,735 people shows a weak positive correlation between the proportion of Poles and unemployment rate among males in the United States with a correlation coefficient (R) of 0.298 and weighted average of 4.9%. Similarly, the statistical analysis conducted on geographies consisting of 479,076,268 people shows a substantial positive correlation between the proportion of Greeks and unemployment rate among males in the United States with a correlation coefficient (R) of 0.541 and weighted average of 5.0%, a difference of 1.6%.
Male Unemployment Correlation Summary
| Measurement | Polish | Greek |
| Minimum | 1.0% | 2.7% |
| Maximum | 55.0% | 25.0% |
| Range | 54.0% | 22.3% |
| Mean | 6.5% | 8.5% |
| Median | 4.8% | 6.3% |
| Interquartile 25% (IQ1) | 4.1% | 4.7% |
| Interquartile 75% (IQ3) | 5.3% | 11.3% |
| Interquartile Range (IQR) | 1.1% | 6.6% |
| Standard Deviation (Sample) | 8.0% | 5.4% |
| Standard Deviation (Population) | 7.9% | 5.3% |
Similar Demographics by Male Unemployment
Demographics Similar to Poles by Male Unemployment
In terms of male unemployment, the demographic groups most similar to Poles are Immigrants from Scotland (4.9%, a difference of 0.010%), Croatian (4.9%, a difference of 0.010%), Austrian (4.9%, a difference of 0.030%), Slovene (5.0%, a difference of 0.040%), and Irish (5.0%, a difference of 0.060%).
| Demographics | Rating | Rank | Male Unemployment |
| Immigrants | Belgium | 99.2 /100 | #42 | Exceptional 4.9% |
| Immigrants | Japan | 99.2 /100 | #43 | Exceptional 4.9% |
| Immigrants | Korea | 99.1 /100 | #44 | Exceptional 4.9% |
| Immigrants | Zimbabwe | 99.0 /100 | #45 | Exceptional 4.9% |
| Bhutanese | 98.9 /100 | #46 | Exceptional 4.9% |
| Austrians | 98.9 /100 | #47 | Exceptional 4.9% |
| Immigrants | Scotland | 98.9 /100 | #48 | Exceptional 4.9% |
| Poles | 98.9 /100 | #49 | Exceptional 4.9% |
| Croatians | 98.9 /100 | #50 | Exceptional 4.9% |
| Slovenes | 98.8 /100 | #51 | Exceptional 5.0% |
| Irish | 98.8 /100 | #52 | Exceptional 5.0% |
| Jordanians | 98.8 /100 | #53 | Exceptional 5.0% |
| Yugoslavians | 98.7 /100 | #54 | Exceptional 5.0% |
| Czechoslovakians | 98.7 /100 | #55 | Exceptional 5.0% |
| Immigrants | Bulgaria | 98.7 /100 | #56 | Exceptional 5.0% |
Demographics Similar to Greeks by Male Unemployment
In terms of male unemployment, the demographic groups most similar to Greeks are Immigrants from North America (5.0%, a difference of 0.030%), Assyrian/Chaldean/Syriac (5.0%, a difference of 0.060%), Immigrants from South Africa (5.0%, a difference of 0.080%), New Zealander (5.0%, a difference of 0.16%), and White/Caucasian (5.0%, a difference of 0.18%).
| Demographics | Rating | Rank | Male Unemployment |
| Finns | 97.5 /100 | #66 | Exceptional 5.0% |
| Immigrants | Canada | 97.5 /100 | #67 | Exceptional 5.0% |
| Australians | 97.4 /100 | #68 | Exceptional 5.0% |
| Immigrants | Sweden | 97.4 /100 | #69 | Exceptional 5.0% |
| Whites/Caucasians | 97.3 /100 | #70 | Exceptional 5.0% |
| New Zealanders | 97.3 /100 | #71 | Exceptional 5.0% |
| Immigrants | South Africa | 97.1 /100 | #72 | Exceptional 5.0% |
| Greeks | 97.0 /100 | #73 | Exceptional 5.0% |
| Immigrants | North America | 96.9 /100 | #74 | Exceptional 5.0% |
| Assyrians/Chaldeans/Syriacs | 96.9 /100 | #75 | Exceptional 5.0% |
| Immigrants | Sudan | 96.5 /100 | #76 | Exceptional 5.0% |
| Iranians | 96.4 /100 | #77 | Exceptional 5.0% |
| Immigrants | Northern Europe | 96.4 /100 | #78 | Exceptional 5.0% |
| South Africans | 96.4 /100 | #79 | Exceptional 5.0% |
| Argentineans | 96.2 /100 | #80 | Exceptional 5.0% |