Immigrants from Asia vs Greek Male Unemployment
COMPARE
Immigrants from Asia
Greek
Male Unemployment
Male Unemployment Comparison
Immigrants from Asia
Greeks
5.1%
MALE UNEMPLOYMENT
89.6/ 100
METRIC RATING
115th/ 347
METRIC RANK
5.0%
MALE UNEMPLOYMENT
97.0/ 100
METRIC RATING
73rd/ 347
METRIC RANK
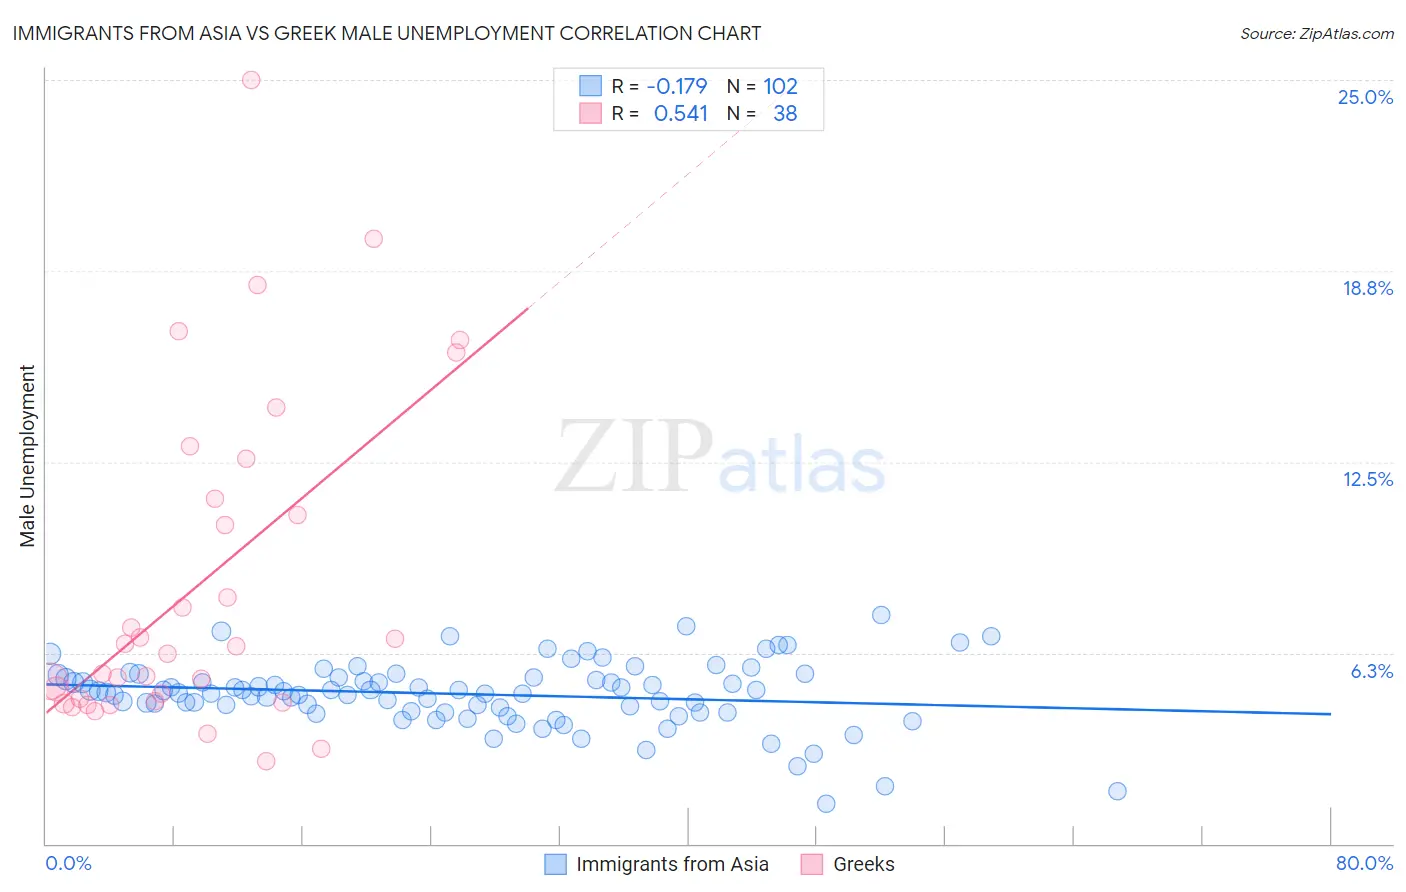
Immigrants from Asia vs Greek Male Unemployment Correlation Chart
The statistical analysis conducted on geographies consisting of 542,340,626 people shows a poor negative correlation between the proportion of Immigrants from Asia and unemployment rate among males in the United States with a correlation coefficient (R) of -0.179 and weighted average of 5.1%. Similarly, the statistical analysis conducted on geographies consisting of 479,076,268 people shows a substantial positive correlation between the proportion of Greeks and unemployment rate among males in the United States with a correlation coefficient (R) of 0.541 and weighted average of 5.0%, a difference of 2.0%.
Male Unemployment Correlation Summary
| Measurement | Immigrants from Asia | Greek |
| Minimum | 1.3% | 2.7% |
| Maximum | 7.5% | 25.0% |
| Range | 6.2% | 22.3% |
| Mean | 4.9% | 8.5% |
| Median | 5.0% | 6.3% |
| Interquartile 25% (IQ1) | 4.3% | 4.7% |
| Interquartile 75% (IQ3) | 5.4% | 11.3% |
| Interquartile Range (IQR) | 1.1% | 6.6% |
| Standard Deviation (Sample) | 1.1% | 5.4% |
| Standard Deviation (Population) | 1.1% | 5.3% |
Similar Demographics by Male Unemployment
Demographics Similar to Immigrants from Asia by Male Unemployment
In terms of male unemployment, the demographic groups most similar to Immigrants from Asia are Romanian (5.1%, a difference of 0.030%), Immigrants from Denmark (5.1%, a difference of 0.040%), Estonian (5.1%, a difference of 0.090%), Immigrants from Moldova (5.1%, a difference of 0.11%), and Immigrants from Austria (5.1%, a difference of 0.11%).
| Demographics | Rating | Rank | Male Unemployment |
| Immigrants | Nicaragua | 91.2 /100 | #108 | Exceptional 5.1% |
| Immigrants | Pakistan | 90.9 /100 | #109 | Exceptional 5.1% |
| Immigrants | England | 90.8 /100 | #110 | Exceptional 5.1% |
| Immigrants | Eastern Asia | 90.8 /100 | #111 | Exceptional 5.1% |
| Immigrants | Moldova | 90.3 /100 | #112 | Exceptional 5.1% |
| Immigrants | Austria | 90.3 /100 | #113 | Exceptional 5.1% |
| Romanians | 89.8 /100 | #114 | Excellent 5.1% |
| Immigrants | Asia | 89.6 /100 | #115 | Excellent 5.1% |
| Immigrants | Denmark | 89.4 /100 | #116 | Excellent 5.1% |
| Estonians | 89.0 /100 | #117 | Excellent 5.1% |
| Cypriots | 88.8 /100 | #118 | Excellent 5.1% |
| French Canadians | 88.6 /100 | #119 | Excellent 5.1% |
| Ukrainians | 88.4 /100 | #120 | Excellent 5.1% |
| Mongolians | 88.4 /100 | #121 | Excellent 5.1% |
| Nicaraguans | 88.2 /100 | #122 | Excellent 5.1% |
Demographics Similar to Greeks by Male Unemployment
In terms of male unemployment, the demographic groups most similar to Greeks are Immigrants from North America (5.0%, a difference of 0.030%), Assyrian/Chaldean/Syriac (5.0%, a difference of 0.060%), Immigrants from South Africa (5.0%, a difference of 0.080%), New Zealander (5.0%, a difference of 0.16%), and White/Caucasian (5.0%, a difference of 0.18%).
| Demographics | Rating | Rank | Male Unemployment |
| Finns | 97.5 /100 | #66 | Exceptional 5.0% |
| Immigrants | Canada | 97.5 /100 | #67 | Exceptional 5.0% |
| Australians | 97.4 /100 | #68 | Exceptional 5.0% |
| Immigrants | Sweden | 97.4 /100 | #69 | Exceptional 5.0% |
| Whites/Caucasians | 97.3 /100 | #70 | Exceptional 5.0% |
| New Zealanders | 97.3 /100 | #71 | Exceptional 5.0% |
| Immigrants | South Africa | 97.1 /100 | #72 | Exceptional 5.0% |
| Greeks | 97.0 /100 | #73 | Exceptional 5.0% |
| Immigrants | North America | 96.9 /100 | #74 | Exceptional 5.0% |
| Assyrians/Chaldeans/Syriacs | 96.9 /100 | #75 | Exceptional 5.0% |
| Immigrants | Sudan | 96.5 /100 | #76 | Exceptional 5.0% |
| Iranians | 96.4 /100 | #77 | Exceptional 5.0% |
| Immigrants | Northern Europe | 96.4 /100 | #78 | Exceptional 5.0% |
| South Africans | 96.4 /100 | #79 | Exceptional 5.0% |
| Argentineans | 96.2 /100 | #80 | Exceptional 5.0% |