Immigrants from Brazil vs Greek Male Unemployment
COMPARE
Immigrants from Brazil
Greek
Male Unemployment
Male Unemployment Comparison
Immigrants from Brazil
Greeks
5.2%
MALE UNEMPLOYMENT
86.3/ 100
METRIC RATING
127th/ 347
METRIC RANK
5.0%
MALE UNEMPLOYMENT
97.0/ 100
METRIC RATING
73rd/ 347
METRIC RANK
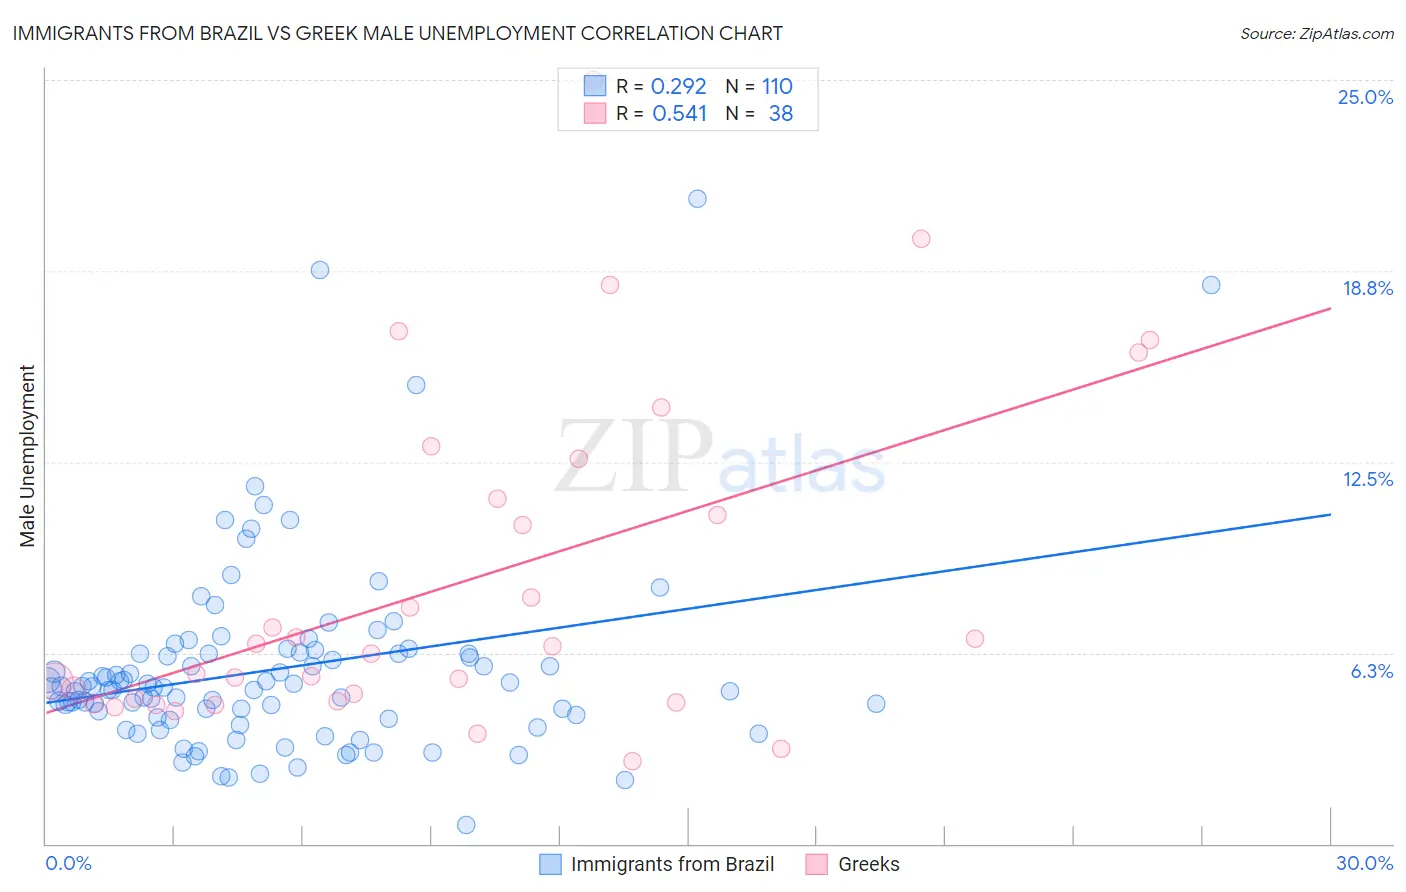
Immigrants from Brazil vs Greek Male Unemployment Correlation Chart
The statistical analysis conducted on geographies consisting of 342,068,748 people shows a weak positive correlation between the proportion of Immigrants from Brazil and unemployment rate among males in the United States with a correlation coefficient (R) of 0.292 and weighted average of 5.2%. Similarly, the statistical analysis conducted on geographies consisting of 479,076,268 people shows a substantial positive correlation between the proportion of Greeks and unemployment rate among males in the United States with a correlation coefficient (R) of 0.541 and weighted average of 5.0%, a difference of 2.5%.
Male Unemployment Correlation Summary
| Measurement | Immigrants from Brazil | Greek |
| Minimum | 0.60% | 2.7% |
| Maximum | 21.1% | 25.0% |
| Range | 20.5% | 22.3% |
| Mean | 5.7% | 8.5% |
| Median | 5.1% | 6.3% |
| Interquartile 25% (IQ1) | 4.1% | 4.7% |
| Interquartile 75% (IQ3) | 6.2% | 11.3% |
| Interquartile Range (IQR) | 2.1% | 6.6% |
| Standard Deviation (Sample) | 3.2% | 5.4% |
| Standard Deviation (Population) | 3.2% | 5.3% |
Similar Demographics by Male Unemployment
Demographics Similar to Immigrants from Brazil by Male Unemployment
In terms of male unemployment, the demographic groups most similar to Immigrants from Brazil are Immigrants from Colombia (5.1%, a difference of 0.060%), Immigrants from Lithuania (5.1%, a difference of 0.11%), Immigrants from Latvia (5.1%, a difference of 0.15%), Hungarian (5.2%, a difference of 0.15%), and Palestinian (5.1%, a difference of 0.18%).
| Demographics | Rating | Rank | Male Unemployment |
| Ukrainians | 88.4 /100 | #120 | Excellent 5.1% |
| Mongolians | 88.4 /100 | #121 | Excellent 5.1% |
| Nicaraguans | 88.2 /100 | #122 | Excellent 5.1% |
| Palestinians | 87.7 /100 | #123 | Excellent 5.1% |
| Immigrants | Latvia | 87.5 /100 | #124 | Excellent 5.1% |
| Immigrants | Lithuania | 87.2 /100 | #125 | Excellent 5.1% |
| Immigrants | Colombia | 86.8 /100 | #126 | Excellent 5.1% |
| Immigrants | Brazil | 86.3 /100 | #127 | Excellent 5.2% |
| Hungarians | 85.1 /100 | #128 | Excellent 5.2% |
| Immigrants | Western Europe | 84.8 /100 | #129 | Excellent 5.2% |
| Immigrants | Malaysia | 83.5 /100 | #130 | Excellent 5.2% |
| Immigrants | Germany | 83.0 /100 | #131 | Excellent 5.2% |
| Chickasaw | 82.9 /100 | #132 | Excellent 5.2% |
| Colombians | 81.1 /100 | #133 | Excellent 5.2% |
| Pakistanis | 80.5 /100 | #134 | Excellent 5.2% |
Demographics Similar to Greeks by Male Unemployment
In terms of male unemployment, the demographic groups most similar to Greeks are Immigrants from North America (5.0%, a difference of 0.030%), Assyrian/Chaldean/Syriac (5.0%, a difference of 0.060%), Immigrants from South Africa (5.0%, a difference of 0.080%), New Zealander (5.0%, a difference of 0.16%), and White/Caucasian (5.0%, a difference of 0.18%).
| Demographics | Rating | Rank | Male Unemployment |
| Finns | 97.5 /100 | #66 | Exceptional 5.0% |
| Immigrants | Canada | 97.5 /100 | #67 | Exceptional 5.0% |
| Australians | 97.4 /100 | #68 | Exceptional 5.0% |
| Immigrants | Sweden | 97.4 /100 | #69 | Exceptional 5.0% |
| Whites/Caucasians | 97.3 /100 | #70 | Exceptional 5.0% |
| New Zealanders | 97.3 /100 | #71 | Exceptional 5.0% |
| Immigrants | South Africa | 97.1 /100 | #72 | Exceptional 5.0% |
| Greeks | 97.0 /100 | #73 | Exceptional 5.0% |
| Immigrants | North America | 96.9 /100 | #74 | Exceptional 5.0% |
| Assyrians/Chaldeans/Syriacs | 96.9 /100 | #75 | Exceptional 5.0% |
| Immigrants | Sudan | 96.5 /100 | #76 | Exceptional 5.0% |
| Iranians | 96.4 /100 | #77 | Exceptional 5.0% |
| Immigrants | Northern Europe | 96.4 /100 | #78 | Exceptional 5.0% |
| South Africans | 96.4 /100 | #79 | Exceptional 5.0% |
| Argentineans | 96.2 /100 | #80 | Exceptional 5.0% |