Immigrants from Northern Africa vs Immigrants from Nigeria Unemployment Among Women with Children Ages 6 to 17 years
COMPARE
Immigrants from Northern Africa
Immigrants from Nigeria
Unemployment Among Women with Children Ages 6 to 17 years
Unemployment Among Women with Children Ages 6 to 17 years Comparison
Immigrants from Northern Africa
Immigrants from Nigeria
8.7%
UNEMPLOYMENT AMONG WOMEN WITH CHILDREN AGES 6 TO 17 YEARS
94.4/ 100
METRIC RATING
126th/ 347
METRIC RANK
10.2%
UNEMPLOYMENT AMONG WOMEN WITH CHILDREN AGES 6 TO 17 YEARS
0.0/ 100
METRIC RATING
305th/ 347
METRIC RANK
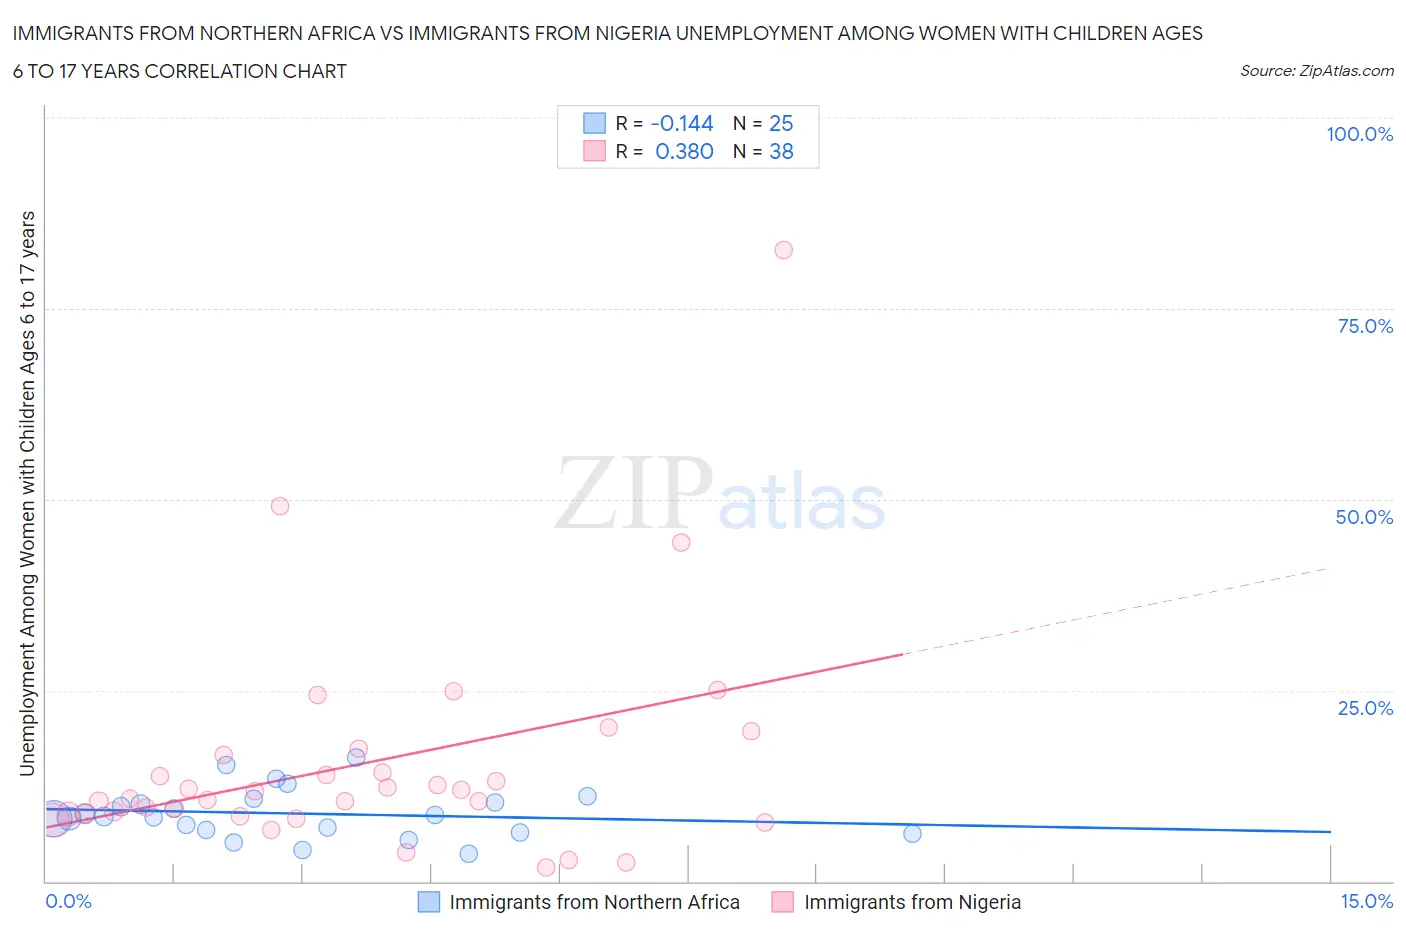
Immigrants from Northern Africa vs Immigrants from Nigeria Unemployment Among Women with Children Ages 6 to 17 years Correlation Chart
The statistical analysis conducted on geographies consisting of 243,403,953 people shows a poor negative correlation between the proportion of Immigrants from Northern Africa and unemployment rate among women with children between the ages 6 and 17 in the United States with a correlation coefficient (R) of -0.144 and weighted average of 8.7%. Similarly, the statistical analysis conducted on geographies consisting of 224,793,064 people shows a mild positive correlation between the proportion of Immigrants from Nigeria and unemployment rate among women with children between the ages 6 and 17 in the United States with a correlation coefficient (R) of 0.380 and weighted average of 10.2%, a difference of 17.4%.
Unemployment Among Women with Children Ages 6 to 17 years Correlation Summary
| Measurement | Immigrants from Northern Africa | Immigrants from Nigeria |
| Minimum | 3.6% | 1.8% |
| Maximum | 16.2% | 82.6% |
| Range | 12.6% | 80.8% |
| Mean | 8.9% | 15.5% |
| Median | 8.5% | 11.3% |
| Interquartile 25% (IQ1) | 6.5% | 8.8% |
| Interquartile 75% (IQ3) | 10.5% | 16.5% |
| Interquartile Range (IQR) | 4.0% | 7.7% |
| Standard Deviation (Sample) | 3.2% | 14.8% |
| Standard Deviation (Population) | 3.1% | 14.6% |
Similar Demographics by Unemployment Among Women with Children Ages 6 to 17 years
Demographics Similar to Immigrants from Northern Africa by Unemployment Among Women with Children Ages 6 to 17 years
In terms of unemployment among women with children ages 6 to 17 years, the demographic groups most similar to Immigrants from Northern Africa are Czech (8.7%, a difference of 0.010%), South African (8.7%, a difference of 0.030%), Hmong (8.7%, a difference of 0.030%), Immigrants from Morocco (8.7%, a difference of 0.10%), and Immigrants from Lebanon (8.7%, a difference of 0.10%).
| Demographics | Rating | Rank | Unemployment Among Women with Children Ages 6 to 17 years |
| Immigrants | Grenada | 96.2 /100 | #119 | Exceptional 8.6% |
| Israelis | 95.9 /100 | #120 | Exceptional 8.7% |
| Immigrants | Denmark | 95.5 /100 | #121 | Exceptional 8.7% |
| Immigrants | Egypt | 95.0 /100 | #122 | Exceptional 8.7% |
| Immigrants | Morocco | 94.9 /100 | #123 | Exceptional 8.7% |
| Immigrants | Lebanon | 94.9 /100 | #124 | Exceptional 8.7% |
| South Africans | 94.6 /100 | #125 | Exceptional 8.7% |
| Immigrants | Northern Africa | 94.4 /100 | #126 | Exceptional 8.7% |
| Czechs | 94.4 /100 | #127 | Exceptional 8.7% |
| Hmong | 94.3 /100 | #128 | Exceptional 8.7% |
| Barbadians | 93.8 /100 | #129 | Exceptional 8.7% |
| Immigrants | Western Asia | 93.1 /100 | #130 | Exceptional 8.7% |
| Slavs | 92.2 /100 | #131 | Exceptional 8.7% |
| Yaqui | 92.2 /100 | #132 | Exceptional 8.7% |
| Egyptians | 91.8 /100 | #133 | Exceptional 8.7% |
Demographics Similar to Immigrants from Nigeria by Unemployment Among Women with Children Ages 6 to 17 years
In terms of unemployment among women with children ages 6 to 17 years, the demographic groups most similar to Immigrants from Nigeria are Immigrants from Venezuela (10.2%, a difference of 0.060%), Immigrants from Ecuador (10.2%, a difference of 0.15%), Paraguayan (10.2%, a difference of 0.29%), Venezuelan (10.2%, a difference of 0.32%), and Immigrants from Senegal (10.2%, a difference of 0.52%).
| Demographics | Rating | Rank | Unemployment Among Women with Children Ages 6 to 17 years |
| Immigrants | Haiti | 0.0 /100 | #298 | Tragic 10.1% |
| Immigrants | Honduras | 0.0 /100 | #299 | Tragic 10.1% |
| Nigerians | 0.0 /100 | #300 | Tragic 10.1% |
| Immigrants | Bahamas | 0.0 /100 | #301 | Tragic 10.1% |
| Venezuelans | 0.0 /100 | #302 | Tragic 10.2% |
| Immigrants | Ecuador | 0.0 /100 | #303 | Tragic 10.2% |
| Immigrants | Venezuela | 0.0 /100 | #304 | Tragic 10.2% |
| Immigrants | Nigeria | 0.0 /100 | #305 | Tragic 10.2% |
| Paraguayans | 0.0 /100 | #306 | Tragic 10.2% |
| Immigrants | Senegal | 0.0 /100 | #307 | Tragic 10.2% |
| Dutch West Indians | 0.0 /100 | #308 | Tragic 10.2% |
| French Canadians | 0.0 /100 | #309 | Tragic 10.3% |
| Alaska Natives | 0.0 /100 | #310 | Tragic 10.3% |
| Immigrants | Liberia | 0.0 /100 | #311 | Tragic 10.3% |
| Africans | 0.0 /100 | #312 | Tragic 10.4% |