Immigrants from Venezuela vs Slovak Male Unemployment
COMPARE
Immigrants from Venezuela
Slovak
Male Unemployment
Male Unemployment Comparison
Immigrants from Venezuela
Slovaks
4.4%
MALE UNEMPLOYMENT
100.0/ 100
METRIC RATING
4th/ 347
METRIC RANK
5.2%
MALE UNEMPLOYMENT
75.5/ 100
METRIC RATING
151st/ 347
METRIC RANK
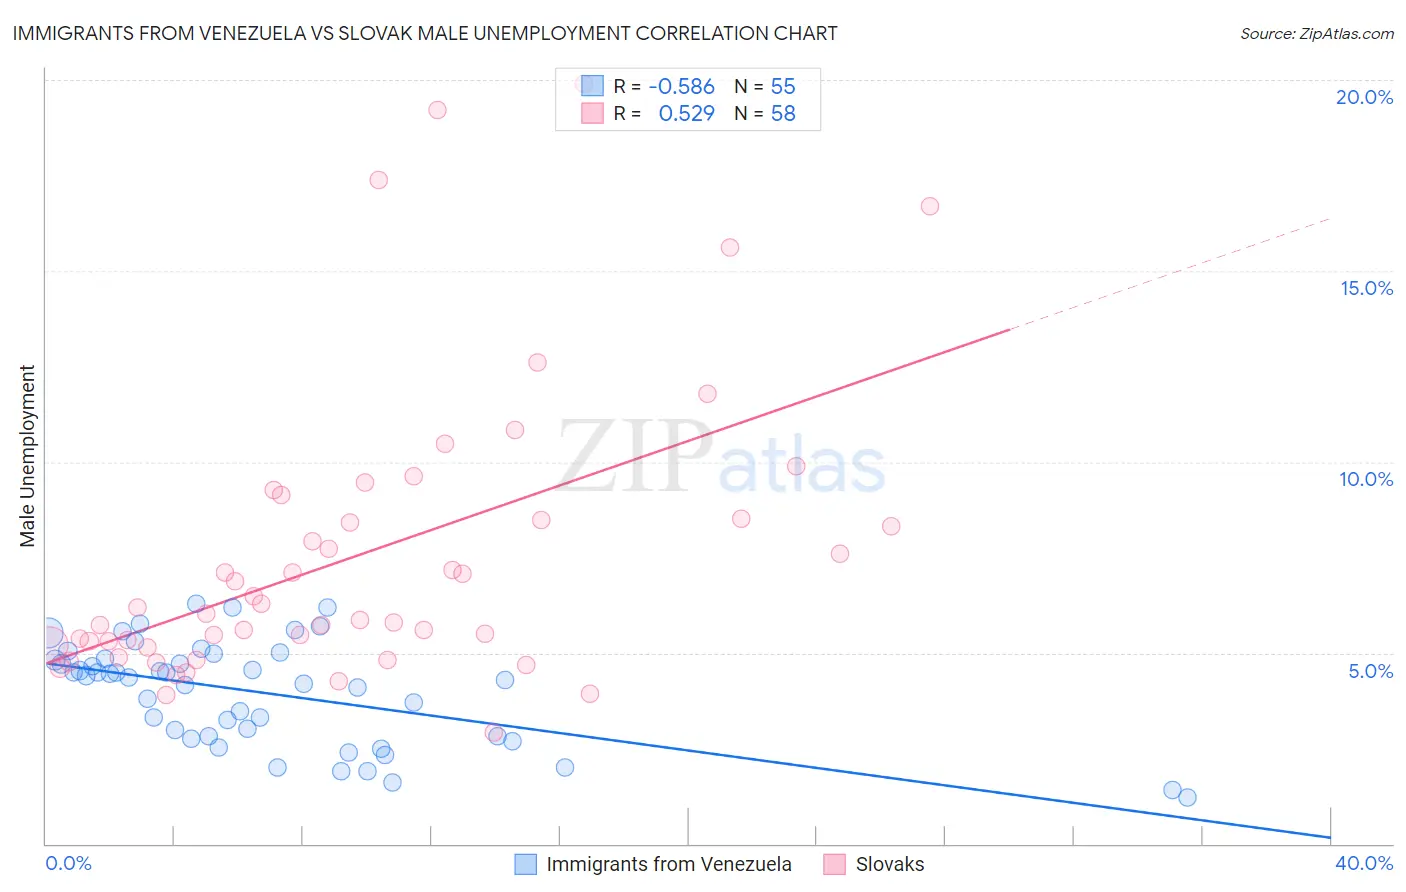
Immigrants from Venezuela vs Slovak Male Unemployment Correlation Chart
The statistical analysis conducted on geographies consisting of 287,397,885 people shows a substantial negative correlation between the proportion of Immigrants from Venezuela and unemployment rate among males in the United States with a correlation coefficient (R) of -0.586 and weighted average of 4.4%. Similarly, the statistical analysis conducted on geographies consisting of 395,477,996 people shows a substantial positive correlation between the proportion of Slovaks and unemployment rate among males in the United States with a correlation coefficient (R) of 0.529 and weighted average of 5.2%, a difference of 17.1%.
Male Unemployment Correlation Summary
| Measurement | Immigrants from Venezuela | Slovak |
| Minimum | 1.2% | 2.9% |
| Maximum | 6.3% | 19.9% |
| Range | 5.1% | 17.0% |
| Mean | 3.9% | 7.6% |
| Median | 4.3% | 6.1% |
| Interquartile 25% (IQ1) | 2.8% | 5.2% |
| Interquartile 75% (IQ3) | 4.9% | 8.5% |
| Interquartile Range (IQR) | 2.1% | 3.3% |
| Standard Deviation (Sample) | 1.3% | 3.8% |
| Standard Deviation (Population) | 1.3% | 3.8% |
Similar Demographics by Male Unemployment
Demographics Similar to Immigrants from Venezuela by Male Unemployment
In terms of male unemployment, the demographic groups most similar to Immigrants from Venezuela are Norwegian (4.4%, a difference of 0.33%), Immigrants from Cuba (4.4%, a difference of 0.58%), Danish (4.5%, a difference of 1.0%), Venezuelan (4.5%, a difference of 1.5%), and Immigrants from India (4.4%, a difference of 1.7%).
| Demographics | Rating | Rank | Male Unemployment |
| Immigrants | India | 100.0 /100 | #1 | Exceptional 4.4% |
| Immigrants | Cuba | 100.0 /100 | #2 | Exceptional 4.4% |
| Norwegians | 100.0 /100 | #3 | Exceptional 4.4% |
| Immigrants | Venezuela | 100.0 /100 | #4 | Exceptional 4.4% |
| Danes | 100.0 /100 | #5 | Exceptional 4.5% |
| Venezuelans | 100.0 /100 | #6 | Exceptional 4.5% |
| Czechs | 100.0 /100 | #7 | Exceptional 4.5% |
| Luxembourgers | 100.0 /100 | #8 | Exceptional 4.5% |
| Thais | 100.0 /100 | #9 | Exceptional 4.6% |
| Cubans | 100.0 /100 | #10 | Exceptional 4.6% |
| Swedes | 100.0 /100 | #11 | Exceptional 4.6% |
| Immigrants | Bolivia | 100.0 /100 | #12 | Exceptional 4.7% |
| Bolivians | 100.0 /100 | #13 | Exceptional 4.7% |
| Germans | 100.0 /100 | #14 | Exceptional 4.7% |
| Scandinavians | 100.0 /100 | #15 | Exceptional 4.7% |
Demographics Similar to Slovaks by Male Unemployment
In terms of male unemployment, the demographic groups most similar to Slovaks are Indian (Asian) (5.2%, a difference of 0.040%), Egyptian (5.2%, a difference of 0.050%), Immigrants from Italy (5.2%, a difference of 0.060%), Immigrants from Europe (5.2%, a difference of 0.060%), and Immigrants from Uruguay (5.2%, a difference of 0.13%).
| Demographics | Rating | Rank | Male Unemployment |
| Sri Lankans | 77.9 /100 | #144 | Good 5.2% |
| Macedonians | 77.7 /100 | #145 | Good 5.2% |
| Immigrants | Kenya | 77.6 /100 | #146 | Good 5.2% |
| Immigrants | Burma/Myanmar | 77.5 /100 | #147 | Good 5.2% |
| Immigrants | Italy | 76.3 /100 | #148 | Good 5.2% |
| Immigrants | Europe | 76.2 /100 | #149 | Good 5.2% |
| Indians (Asian) | 76.0 /100 | #150 | Good 5.2% |
| Slovaks | 75.5 /100 | #151 | Good 5.2% |
| Egyptians | 74.8 /100 | #152 | Good 5.2% |
| Immigrants | Uruguay | 73.9 /100 | #153 | Good 5.2% |
| Laotians | 73.8 /100 | #154 | Good 5.2% |
| Immigrants | Hungary | 73.4 /100 | #155 | Good 5.2% |
| Americans | 72.7 /100 | #156 | Good 5.2% |
| Immigrants | Northern Africa | 72.3 /100 | #157 | Good 5.2% |
| Immigrants | Indonesia | 71.5 /100 | #158 | Good 5.2% |