Immigrants from Venezuela vs Tsimshian Male Unemployment
COMPARE
Immigrants from Venezuela
Tsimshian
Male Unemployment
Male Unemployment Comparison
Immigrants from Venezuela
Tsimshian
4.4%
MALE UNEMPLOYMENT
100.0/ 100
METRIC RATING
4th/ 347
METRIC RANK
8.5%
MALE UNEMPLOYMENT
0.0/ 100
METRIC RATING
334th/ 347
METRIC RANK
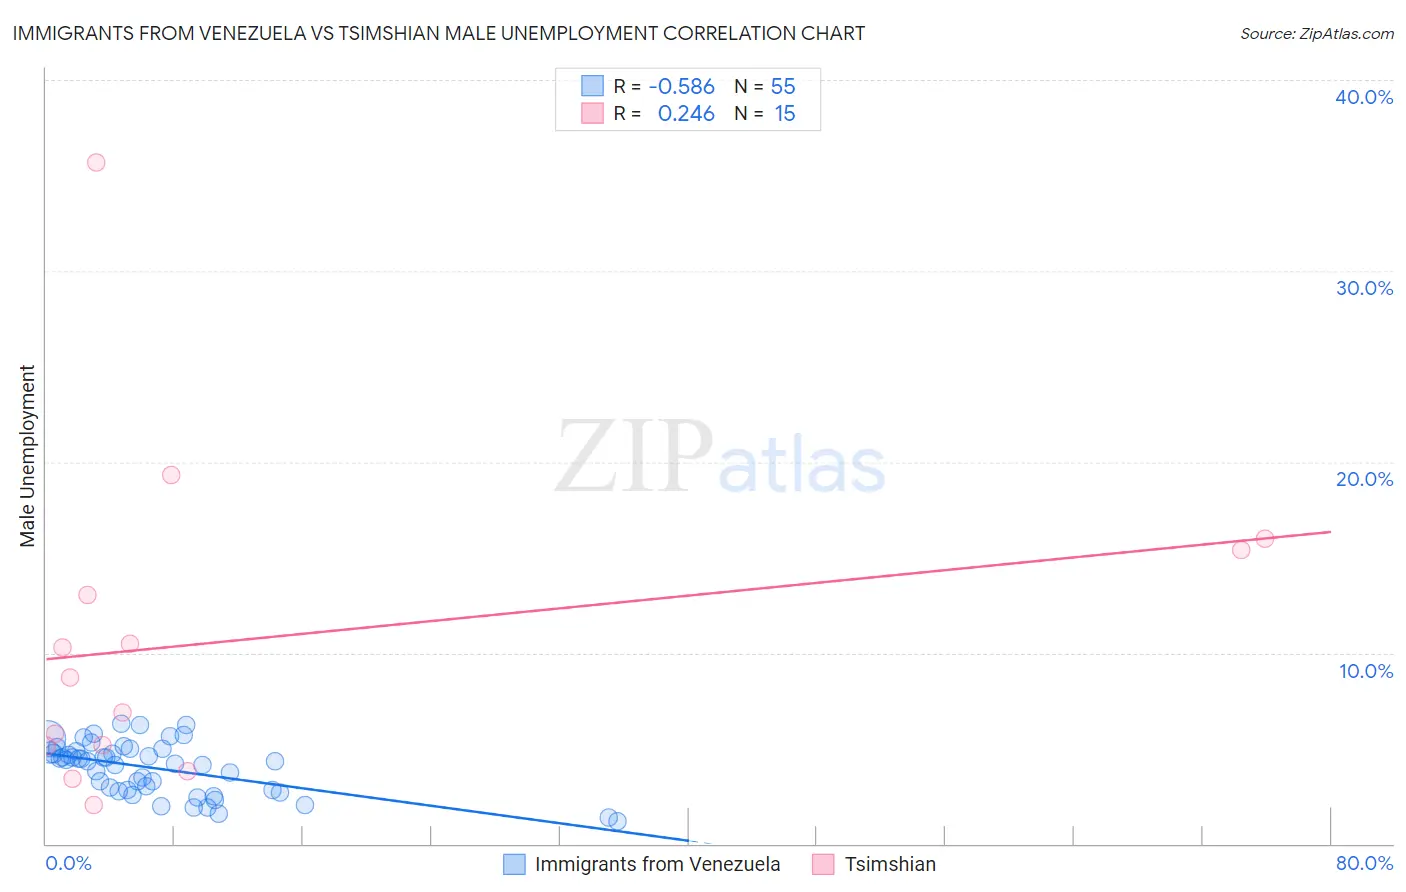
Immigrants from Venezuela vs Tsimshian Male Unemployment Correlation Chart
The statistical analysis conducted on geographies consisting of 287,397,885 people shows a substantial negative correlation between the proportion of Immigrants from Venezuela and unemployment rate among males in the United States with a correlation coefficient (R) of -0.586 and weighted average of 4.4%. Similarly, the statistical analysis conducted on geographies consisting of 15,613,259 people shows a weak positive correlation between the proportion of Tsimshian and unemployment rate among males in the United States with a correlation coefficient (R) of 0.246 and weighted average of 8.5%, a difference of 90.2%.
Male Unemployment Correlation Summary
| Measurement | Immigrants from Venezuela | Tsimshian |
| Minimum | 1.2% | 2.0% |
| Maximum | 6.3% | 35.7% |
| Range | 5.1% | 33.7% |
| Mean | 3.9% | 10.7% |
| Median | 4.3% | 8.7% |
| Interquartile 25% (IQ1) | 2.8% | 5.1% |
| Interquartile 75% (IQ3) | 4.9% | 15.4% |
| Interquartile Range (IQR) | 2.1% | 10.3% |
| Standard Deviation (Sample) | 1.3% | 8.6% |
| Standard Deviation (Population) | 1.3% | 8.3% |
Similar Demographics by Male Unemployment
Demographics Similar to Immigrants from Venezuela by Male Unemployment
In terms of male unemployment, the demographic groups most similar to Immigrants from Venezuela are Norwegian (4.4%, a difference of 0.33%), Immigrants from Cuba (4.4%, a difference of 0.58%), Danish (4.5%, a difference of 1.0%), Venezuelan (4.5%, a difference of 1.5%), and Immigrants from India (4.4%, a difference of 1.7%).
| Demographics | Rating | Rank | Male Unemployment |
| Immigrants | India | 100.0 /100 | #1 | Exceptional 4.4% |
| Immigrants | Cuba | 100.0 /100 | #2 | Exceptional 4.4% |
| Norwegians | 100.0 /100 | #3 | Exceptional 4.4% |
| Immigrants | Venezuela | 100.0 /100 | #4 | Exceptional 4.4% |
| Danes | 100.0 /100 | #5 | Exceptional 4.5% |
| Venezuelans | 100.0 /100 | #6 | Exceptional 4.5% |
| Czechs | 100.0 /100 | #7 | Exceptional 4.5% |
| Luxembourgers | 100.0 /100 | #8 | Exceptional 4.5% |
| Thais | 100.0 /100 | #9 | Exceptional 4.6% |
| Cubans | 100.0 /100 | #10 | Exceptional 4.6% |
| Swedes | 100.0 /100 | #11 | Exceptional 4.6% |
| Immigrants | Bolivia | 100.0 /100 | #12 | Exceptional 4.7% |
| Bolivians | 100.0 /100 | #13 | Exceptional 4.7% |
| Germans | 100.0 /100 | #14 | Exceptional 4.7% |
| Scandinavians | 100.0 /100 | #15 | Exceptional 4.7% |
Demographics Similar to Tsimshian by Male Unemployment
In terms of male unemployment, the demographic groups most similar to Tsimshian are Pueblo (8.5%, a difference of 0.060%), Sioux (8.4%, a difference of 0.97%), Yuman (8.6%, a difference of 1.4%), Puerto Rican (8.6%, a difference of 1.5%), and Apache (8.6%, a difference of 1.7%).
| Demographics | Rating | Rank | Male Unemployment |
| Paiute | 0.0 /100 | #327 | Tragic 7.7% |
| Natives/Alaskans | 0.0 /100 | #328 | Tragic 7.7% |
| Immigrants | Yemen | 0.0 /100 | #329 | Tragic 7.8% |
| Yakama | 0.0 /100 | #330 | Tragic 7.9% |
| Alaska Natives | 0.0 /100 | #331 | Tragic 8.1% |
| Pima | 0.0 /100 | #332 | Tragic 8.3% |
| Sioux | 0.0 /100 | #333 | Tragic 8.4% |
| Tsimshian | 0.0 /100 | #334 | Tragic 8.5% |
| Pueblo | 0.0 /100 | #335 | Tragic 8.5% |
| Yuman | 0.0 /100 | #336 | Tragic 8.6% |
| Puerto Ricans | 0.0 /100 | #337 | Tragic 8.6% |
| Apache | 0.0 /100 | #338 | Tragic 8.6% |
| Cheyenne | 0.0 /100 | #339 | Tragic 9.8% |
| Alaskan Athabascans | 0.0 /100 | #340 | Tragic 9.8% |
| Navajo | 0.0 /100 | #341 | Tragic 9.8% |