Immigrants from Venezuela vs Armenian Male Unemployment
COMPARE
Immigrants from Venezuela
Armenian
Male Unemployment
Male Unemployment Comparison
Immigrants from Venezuela
Armenians
4.4%
MALE UNEMPLOYMENT
100.0/ 100
METRIC RATING
4th/ 347
METRIC RANK
6.0%
MALE UNEMPLOYMENT
0.0/ 100
METRIC RATING
273rd/ 347
METRIC RANK
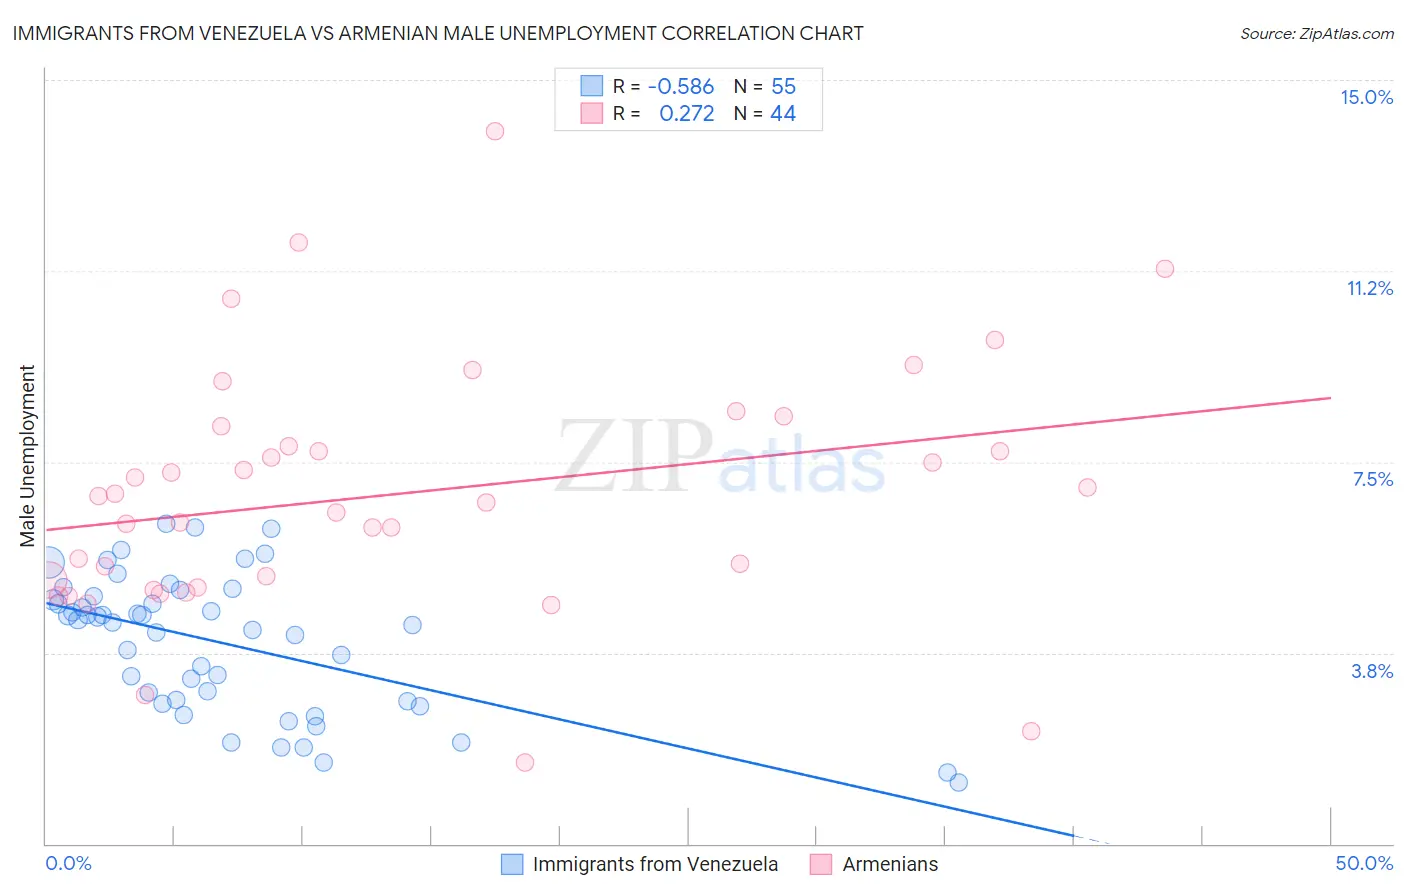
Immigrants from Venezuela vs Armenian Male Unemployment Correlation Chart
The statistical analysis conducted on geographies consisting of 287,397,885 people shows a substantial negative correlation between the proportion of Immigrants from Venezuela and unemployment rate among males in the United States with a correlation coefficient (R) of -0.586 and weighted average of 4.4%. Similarly, the statistical analysis conducted on geographies consisting of 310,068,401 people shows a weak positive correlation between the proportion of Armenians and unemployment rate among males in the United States with a correlation coefficient (R) of 0.272 and weighted average of 6.0%, a difference of 35.0%.
Male Unemployment Correlation Summary
| Measurement | Immigrants from Venezuela | Armenian |
| Minimum | 1.2% | 1.6% |
| Maximum | 6.3% | 14.0% |
| Range | 5.1% | 12.4% |
| Mean | 3.9% | 6.9% |
| Median | 4.3% | 6.8% |
| Interquartile 25% (IQ1) | 2.8% | 5.1% |
| Interquartile 75% (IQ3) | 4.9% | 8.0% |
| Interquartile Range (IQR) | 2.1% | 2.9% |
| Standard Deviation (Sample) | 1.3% | 2.4% |
| Standard Deviation (Population) | 1.3% | 2.4% |
Similar Demographics by Male Unemployment
Demographics Similar to Immigrants from Venezuela by Male Unemployment
In terms of male unemployment, the demographic groups most similar to Immigrants from Venezuela are Norwegian (4.4%, a difference of 0.33%), Immigrants from Cuba (4.4%, a difference of 0.58%), Danish (4.5%, a difference of 1.0%), Venezuelan (4.5%, a difference of 1.5%), and Immigrants from India (4.4%, a difference of 1.7%).
| Demographics | Rating | Rank | Male Unemployment |
| Immigrants | India | 100.0 /100 | #1 | Exceptional 4.4% |
| Immigrants | Cuba | 100.0 /100 | #2 | Exceptional 4.4% |
| Norwegians | 100.0 /100 | #3 | Exceptional 4.4% |
| Immigrants | Venezuela | 100.0 /100 | #4 | Exceptional 4.4% |
| Danes | 100.0 /100 | #5 | Exceptional 4.5% |
| Venezuelans | 100.0 /100 | #6 | Exceptional 4.5% |
| Czechs | 100.0 /100 | #7 | Exceptional 4.5% |
| Luxembourgers | 100.0 /100 | #8 | Exceptional 4.5% |
| Thais | 100.0 /100 | #9 | Exceptional 4.6% |
| Cubans | 100.0 /100 | #10 | Exceptional 4.6% |
| Swedes | 100.0 /100 | #11 | Exceptional 4.6% |
| Immigrants | Bolivia | 100.0 /100 | #12 | Exceptional 4.7% |
| Bolivians | 100.0 /100 | #13 | Exceptional 4.7% |
| Germans | 100.0 /100 | #14 | Exceptional 4.7% |
| Scandinavians | 100.0 /100 | #15 | Exceptional 4.7% |
Demographics Similar to Armenians by Male Unemployment
In terms of male unemployment, the demographic groups most similar to Armenians are Immigrants from Uzbekistan (6.0%, a difference of 0.010%), Immigrants from Sierra Leone (6.0%, a difference of 0.17%), Blackfeet (6.0%, a difference of 0.24%), Menominee (6.0%, a difference of 0.33%), and Tlingit-Haida (6.0%, a difference of 0.43%).
| Demographics | Rating | Rank | Male Unemployment |
| Bahamians | 0.0 /100 | #266 | Tragic 5.9% |
| Nigerians | 0.0 /100 | #267 | Tragic 5.9% |
| Bermudans | 0.0 /100 | #268 | Tragic 5.9% |
| Immigrants | Nigeria | 0.0 /100 | #269 | Tragic 6.0% |
| Sub-Saharan Africans | 0.0 /100 | #270 | Tragic 6.0% |
| Blackfeet | 0.0 /100 | #271 | Tragic 6.0% |
| Immigrants | Uzbekistan | 0.0 /100 | #272 | Tragic 6.0% |
| Armenians | 0.0 /100 | #273 | Tragic 6.0% |
| Immigrants | Sierra Leone | 0.0 /100 | #274 | Tragic 6.0% |
| Menominee | 0.0 /100 | #275 | Tragic 6.0% |
| Tlingit-Haida | 0.0 /100 | #276 | Tragic 6.0% |
| Immigrants | Liberia | 0.0 /100 | #277 | Tragic 6.1% |
| Immigrants | Fiji | 0.0 /100 | #278 | Tragic 6.1% |
| Ghanaians | 0.0 /100 | #279 | Tragic 6.1% |
| Immigrants | Ghana | 0.0 /100 | #280 | Tragic 6.2% |